


FXOpen

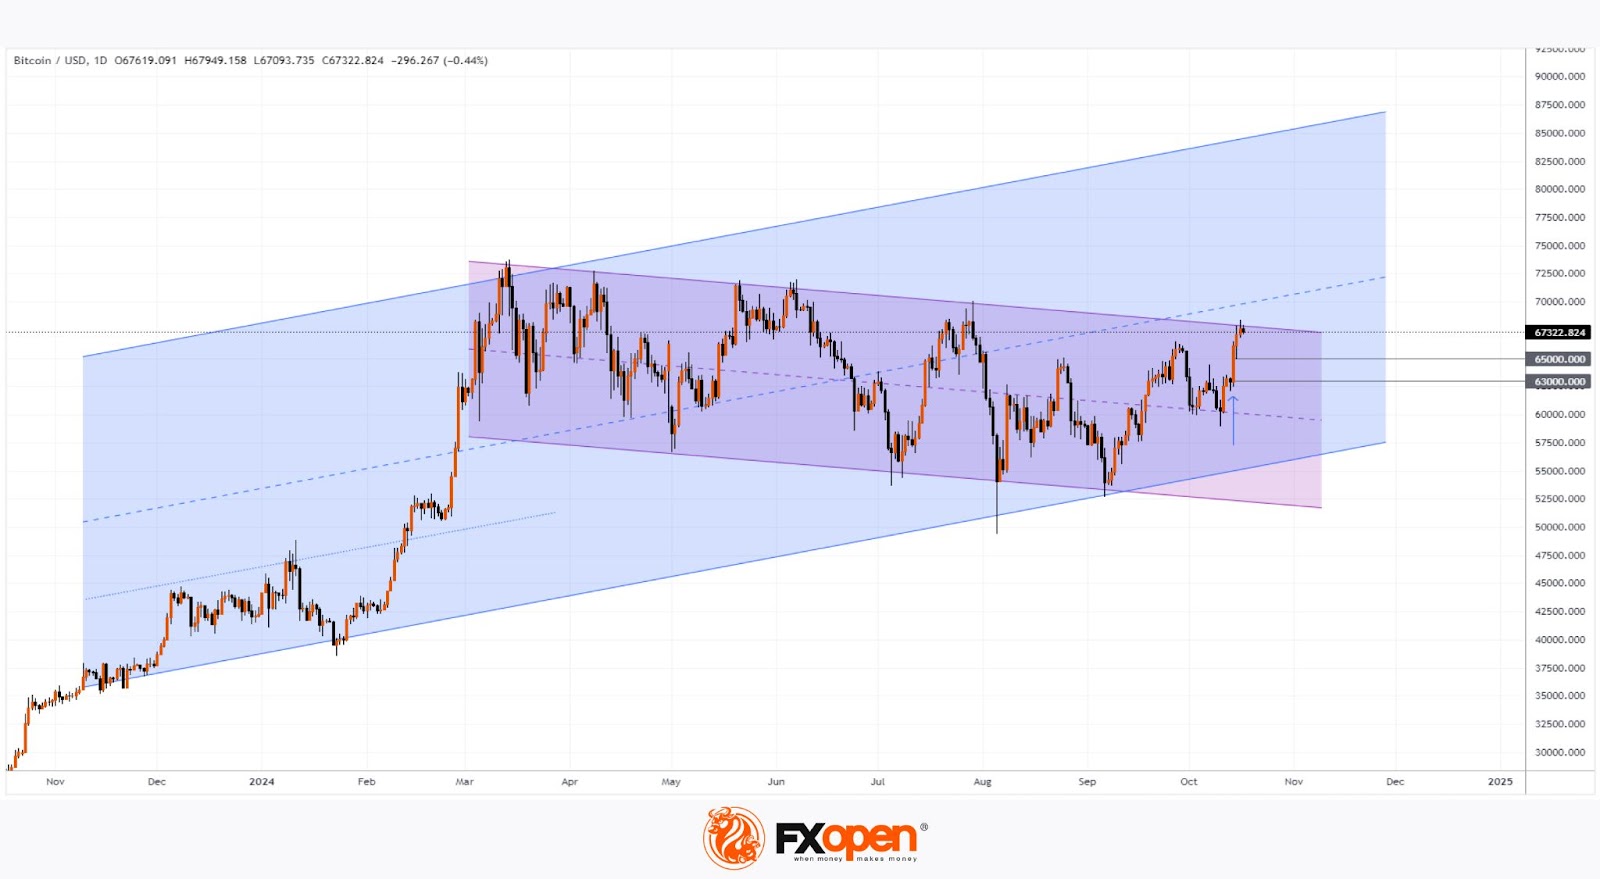
According to the BTC/USD chart, Bitcoin's price reached $68,000 in mid-October, a level not seen since late July. Can this upward momentum continue?
Jeff Kendrick, head of digital asset research at Standard Chartered Bank, predicts that Bitcoin could rise to $73,800 before the US presidential elections in November, which would mark a new all-time high.
Kendrick highlights several factors that may drive Bitcoin's price higher:
→ Less stringent regulation: A more favourable regulatory environment, as indicated by recent news regarding BNY Mellon's accounting practices, could benefit Bitcoin's price.
→ MicroStrategy's ambitions: The company plans to transform into a "Bitcoin bank," potentially enabling it to generate revenue by lending cryptocurrency in the future.
Today's technical analysis of the BTC/USD chart reveals:
→ The price is forming a long-term upward channel (shown in blue).
→ Since March, price fluctuations have created a downward channel (shown in purple), which may be seen as an interim correction within the main bullish trend. Technical analysts might refer to this as a "bullish flag" pattern.
→ A significant price increase on October 14 led to the formation of a bullish Fair Value Gap (FVG), indicating buyer dominance over sellers.
Given these factors, it is reasonable to expect that the $63,000 to $65,000 range could serve as a launchpad for bulls aiming to break through the multi-month resistance represented by the upper boundary of the purple corrective channel.
FXOpen offers the world's most popular cryptocurrency CFDs*, including Bitcoin and Ethereum. Floating spreads, 1:2 leverage — at your service (additional fees may apply). Open your trading account now or learn more about crypto CFD trading with FXOpen.
*Important: At FXOpen UK, Cryptocurrency trading via CFDs is only available to our Professional clients. They are not available for trading by Retail clients. To find out more information about how this may affect you, please get in touch with our team.
This article represents the opinion of the Companies operating under the FXOpen brand only. It is not to be construed as an offer, solicitation, or recommendation with respect to products and services provided by the Companies operating under the FXOpen brand, nor is it to be considered financial advice.
Stay ahead of the market!
Subscribe now to our mailing list and receive the latest market news and insights delivered directly to your inbox.


Latest articles

Gold Price Holds Near Key Support
As the XAU/USD chart shows, the gold price has been holding within the $5,060–$5,200 range over the past several sessions.
Bullish view: the key support is the lower boundary of the long-term channel that has been

EUR/USD Chart Analysis: Pair Rebounds from the Year’s Low
Analysing the EUR/USD chart five days ago, we:
→ constructed a downward channel, noting signs that the bears remained in control;
→ outlined a scenario in which the rate would decline to a new yearly low (and test the lower boundary

Dollar Index (DXY) Hits Yearly High
Today, the dollar index rose above last week’s peak around the 99.68 level, setting a new high for 2026. This movement is supported by a tense fundamental backdrop:
→ Inflationary pressures from rising oil prices. Markets may be pricing