


Apple (AAPL) Shares Jump to a Six-Month High
FXOpen
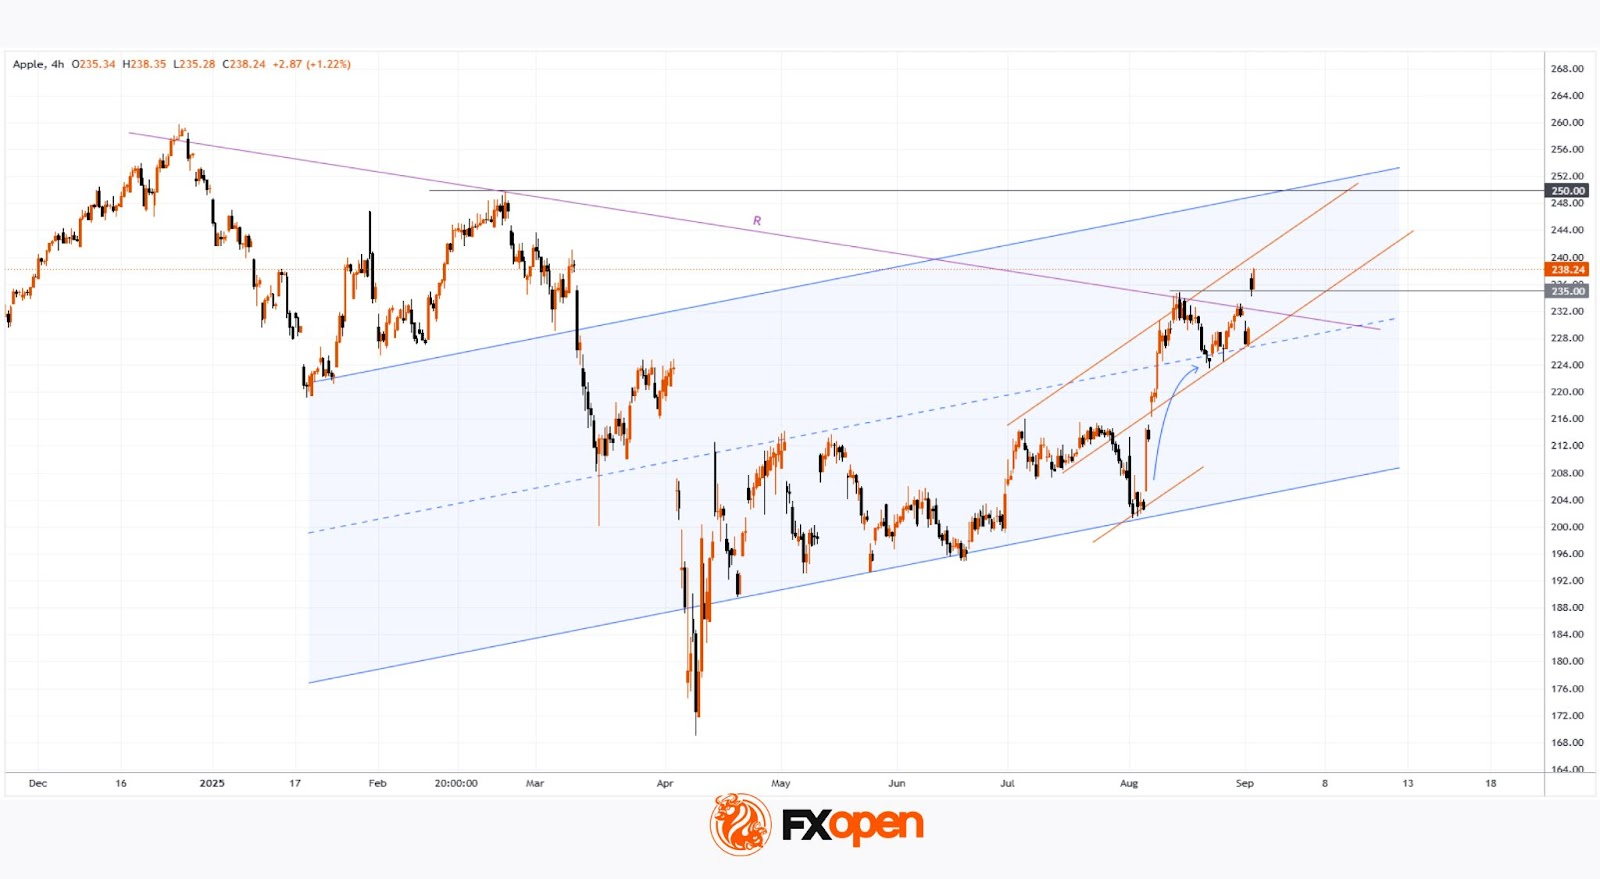
As the AAPL chart shows, yesterday the price rose above $238 – its highest level since early March.
The optimistic sentiment was fuelled by:
→ A court ruling concerning Google, which we reported on yesterday. Apple shares advanced after the court allowed Alphabet to continue paying Apple for preloading Google Search on the iPhone. Bank of America analysts even raised their AAPL price target to $260.
→ The upcoming Apple presentation scheduled for 9 September. Expectations are that the event could unveil the iPhone 17 and new Apple Watch models, which may provide a bullish catalyst.
Technical Analysis of Apple (AAPL) Stocks
Analysing the chart in early August, we:
→ identified an ascending channel (shown in blue);
→ noted that, given the aggressive rally (accompanied by bullish gaps) and a strong fundamental backdrop, any corrections were likely to be limited.
Since then:
→ AAPL has moved higher, justifying the expansion of the blue channel;
→ the pullback (marked by an arrow) was minor, as expected, confirming the median line of the expanded channel as support;
→ in the short term, we could identify grounds for a new upward trajectory (shown in orange).
Yesterday’s price action in AAPL:
→ produced a wide bullish gap at the open (which may act as support);
→ broke through the long-term descending trendline (R), which had been acting as resistance;
→ indicated that the $235 level (around the August high) now functions as support.
Within this context, we could assume that:
→ in the short term, AAPL may maintain its upward trajectory within the orange channel;
→ in the longer term, bulls may target the upper boundary of the blue channel – located near the psychological $250 mark. Reaching this level could trigger stronger selling pressure.
In the event of a significant correction (for example, due to disappointment with new product launches), potential support levels could include:
→ the median of the blue channel;
→ the trendline R.
Buy and sell stocks of the world's biggest publicly-listed companies with CFDs on FXOpen’s trading platform. Open your FXOpen account now or learn more about trading share CFDs with FXOpen.
This article represents the opinion of the Companies operating under the FXOpen brand only. It is not to be construed as an offer, solicitation, or recommendation with respect to products and services provided by the Companies operating under the FXOpen brand, nor is it to be considered financial advice.
Stay ahead of the market!
Subscribe now to our mailing list and receive the latest market news and insights delivered directly to your inbox.


Latest articles


Market Repricing of Risk as Gold Loses Safe-Haven Demand
Geopolitical tensions in the Middle East had remained the primary macro driver for the gold market over recent weeks; however, on 8 April the situation shifted sharply as the United States and Iran agreed to a temporary two-week ceasefire, including

Commodity Currencies on the Rise: Market Focus Shifts to US and Canadian Data
Commodity-linked currencies continue to strengthen, while the US dollar remains under pressure amid easing geopolitical tensions and a shift in investor preference towards riskier assets. Reports of a temporary ceasefire between the US and Iran have helped stabilise sentiment and