


FXOpen

The Apple (AAPL) stock chart reveals:
→ Yesterday’s closing price exceeded $242 for the first time in history.
→ The stock has risen nearly 30% since the start of 2024.
→ Over the past 30 days, it has gained approximately 9%.
Dan Ives, an analyst at Wedbush, commented that: "Wall Street is beginning to grasp that the iPhone 16 marks the start of a supercycle." According to his insights shared via Barron’s:
→ Sales in China remain robust.
→ New AI-powered features in the iPhone 16 could drive over 90 million users to upgrade.
→ This could lead to a record-breaking year for iPhone sales and push Apple’s market capitalization to $4 trillion by 2025.
Ives has set a price target for AAPL at $300—roughly 23% above current levels. But is now the right time to invest in AAPL stock?
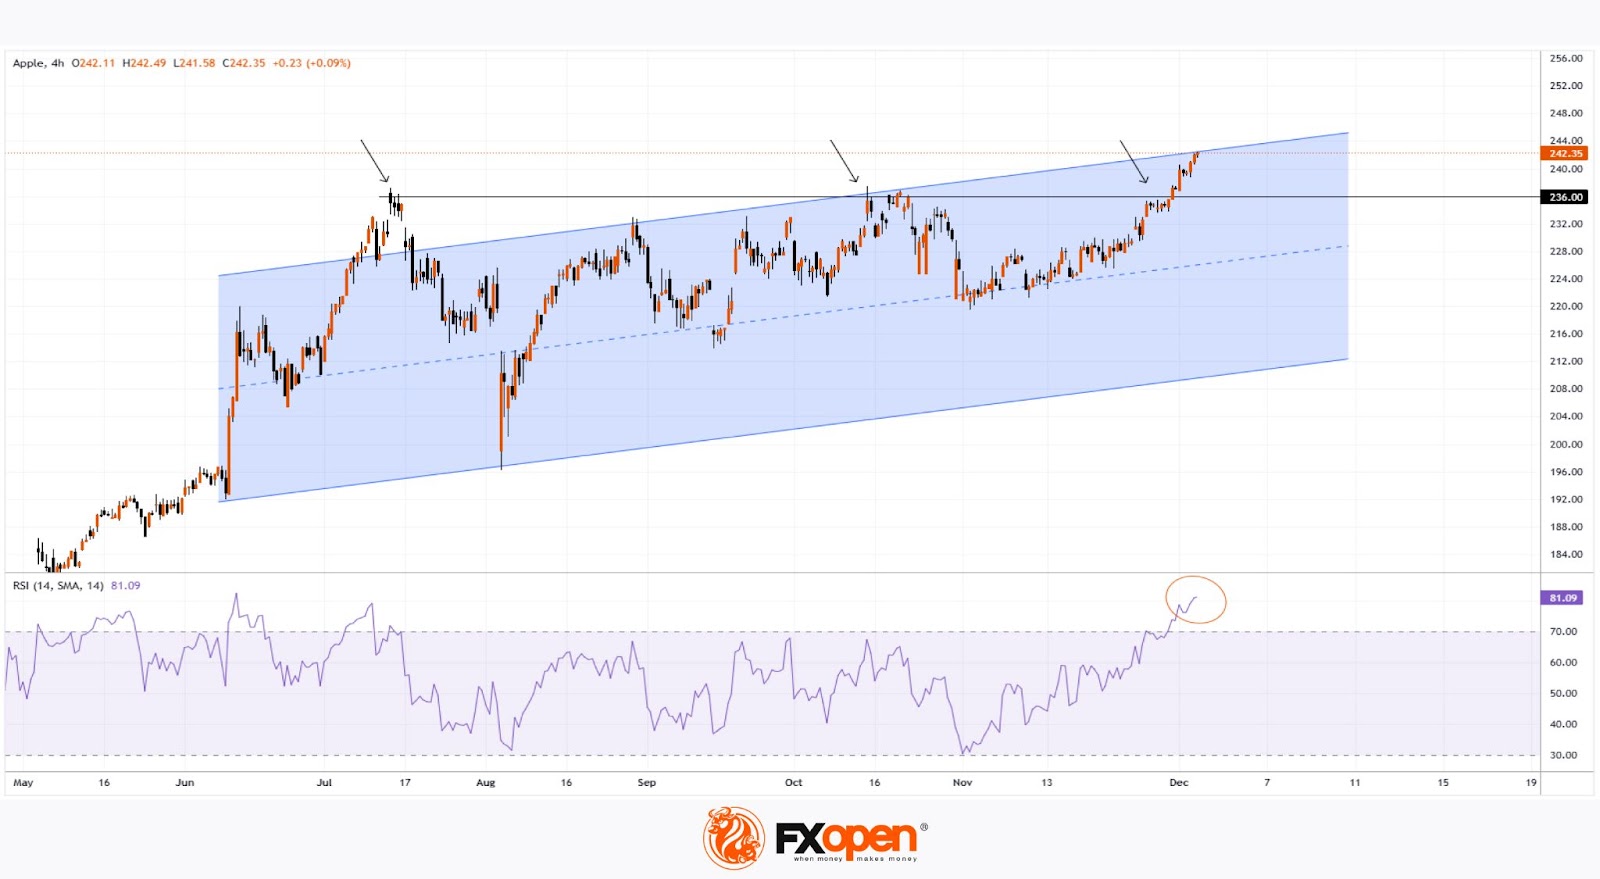
Technical Analysis of AAPL’s 4-Hour Chart:
→ The RSI indicator is in the overbought zone.
→ The price is near the upper boundary of an ascending channel (marked in blue), which formed after the company introduced Apple Intelligence in June.
This positioning suggests the stock may be vulnerable to a correction. If that occurs, the price could test the $236 level, which previously acted as resistance (as shown by arrows).
According to TipRanks:
→ 23 out of 33 analysts recommend buying AAPL stock.
→ The average 12-month price target for AAPL is $243.
Buy and sell stocks of the world's biggest publicly-listed companies with CFDs on FXOpen’s trading platform. Open your FXOpen account now or learn more about trading share CFDs with FXOpen.
This article represents the opinion of the Companies operating under the FXOpen brand only. It is not to be construed as an offer, solicitation, or recommendation with respect to products and services provided by the Companies operating under the FXOpen brand, nor is it to be considered financial advice.
Stay ahead of the market!
Subscribe now to our mailing list and receive the latest market news and insights delivered directly to your inbox.


Latest articles

Gold Price Holds Near Key Support
As the XAU/USD chart shows, the gold price has been holding within the $5,060–$5,200 range over the past several sessions.
Bullish view: the key support is the lower boundary of the long-term channel that has been

EUR/USD Chart Analysis: Pair Rebounds from the Year’s Low
Analysing the EUR/USD chart five days ago, we:
→ constructed a downward channel, noting signs that the bears remained in control;
→ outlined a scenario in which the rate would decline to a new yearly low (and test the lower boundary

Dollar Index (DXY) Hits Yearly High
Today, the dollar index rose above last week’s peak around the 99.68 level, setting a new high for 2026. This movement is supported by a tense fundamental backdrop:
→ Inflationary pressures from rising oil prices. Markets may be pricing