


FXOpen

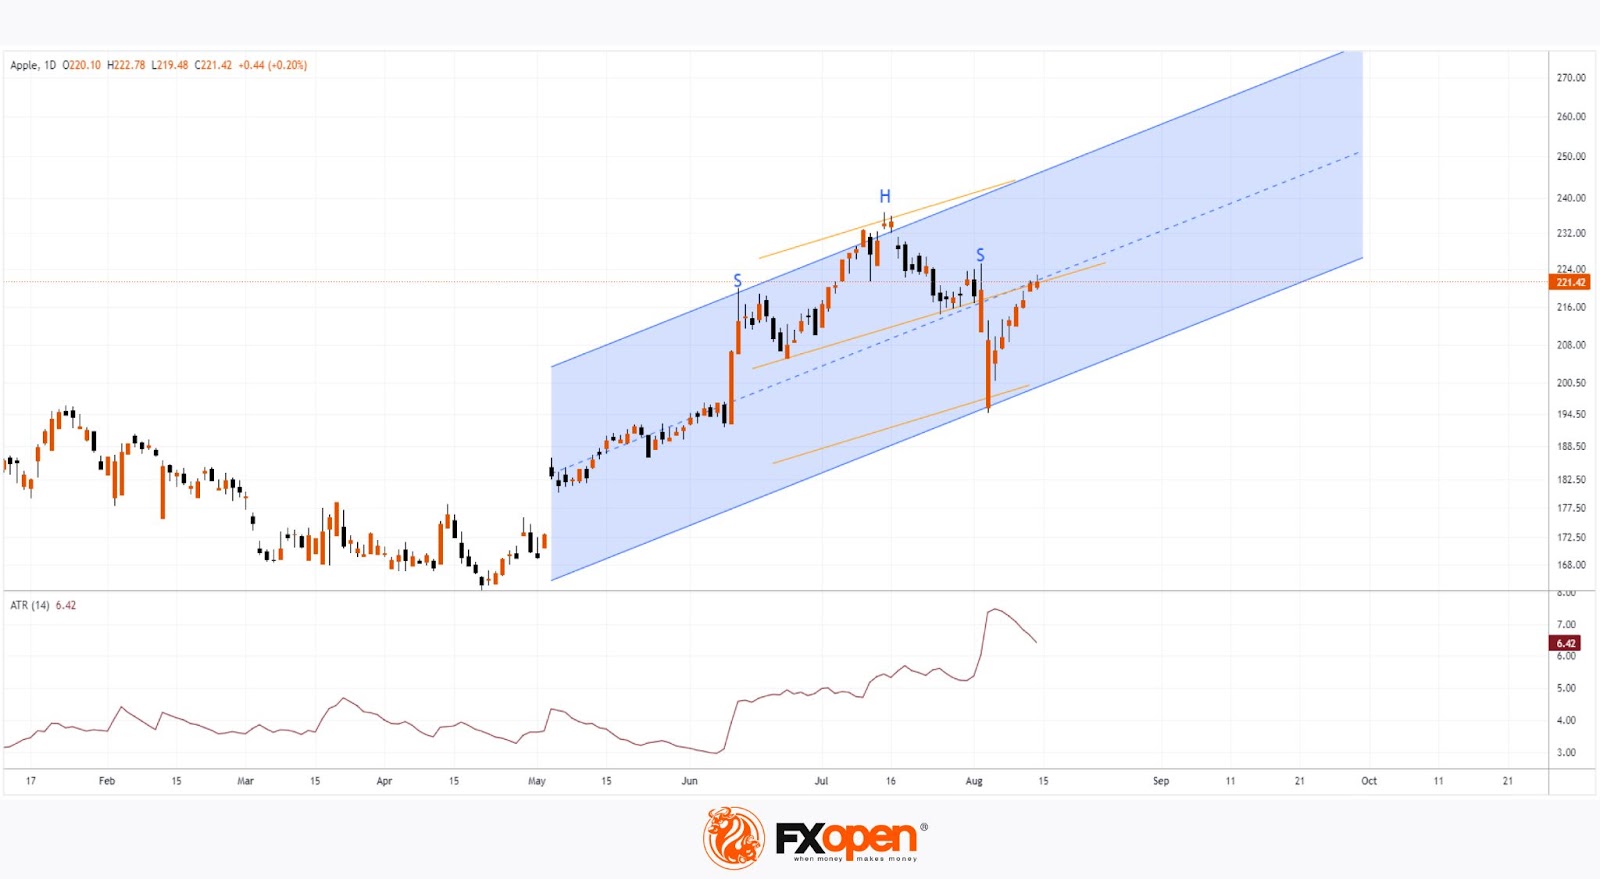
If we define bullish candles as those where the closing price is higher than the opening price, we can observe a sequence of 9 such candles on Apple Inc.'s (AAPL) daily chart from August 2nd to 14th.
On August 6th, we mentioned that market participants were bearish due to news that Warren Buffett had sold half of his Apple Inc. (AAPL) shares, but the situation has since reversed.
Now, bullish sentiment is gaining support from news related to George Soros purchasing Apple Inc. (AAPL) shares. According to MarketWatch, Soros Fund Management LLC has invested in Apple Inc. along with other tech companies, including Broadcom Inc. (AVGO), Micron Technology (MU), Texas Instruments Inc. (TXN), and Super Micro Computer Inc. (SMCI).
Today's technical analysis of the AAPL chart shows that:
→ Bulls have recovered from the price drop to the August 5th low. It's interesting to note that the August 5th low can be calculated using the height of the Head and Shoulders pattern, measuring downward from the neckline break (as shown by the yellow lines).
→ The price is hovering around the median line of a channel constructed using the Linear Regression tool. The fact that the price is approximately in the middle between the extreme deviations suggests the possibility of consolidation. This would be appropriate, given that the ATR indicator shows the market experienced a period of extreme volatility at the beginning of August.
The chart may continue to show a series of bullish candles, but they might have small bodies, reflecting modest gains along the median line.
According to a survey of 32 Wall Street analysts by TipRanks, 24 recommend buying Apple stock. Their average price target for AAPL is $248.78 within the next 12 months.
Read analytical AAPL price forecasts for 2024 and beyond.
Buy and sell stocks of the world's biggest publicly-listed companies with CFDs on FXOpen’s trading platform. Open your FXOpen account now or learn more about trading share CFDs with FXOpen.
This article represents the opinion of the Companies operating under the FXOpen brand only. It is not to be construed as an offer, solicitation, or recommendation with respect to products and services provided by the Companies operating under the FXOpen brand, nor is it to be considered financial advice.
Stay ahead of the market!
Subscribe now to our mailing list and receive the latest market news and insights delivered directly to your inbox.


Latest articles

European Currencies Decline: Pound Hits New Lows, Euro Under Pressure
European currencies continue to weaken against the US dollar amid rising geopolitical tensions and increased demand for safe-haven and liquid assets. Market participants are reducing exposure to riskier instruments, putting pressure on both the euro and the pound. Additional support

Market Analysis: GBP/USD Dips Further As EUR/GBP Regains Traction
GBP/USD failed to climb above 1.3500 and corrected some gains. EUR/GBP started a decent increase and might aim for more gains above 0.8700.
Important Takeaways for GBP/USD and EUR/GBP Analysis Today
· The British Pound
