


Apple Shares (AAPL) Fall After iPhone 17 Launch
FXOpen

Yesterday, Apple unveiled its new products, including the iPhone 17. The new model features a sleeker form factor, an improved display and battery, and a new processor. However, analysts believe the model lacks the breakthrough impact needed to drive the stock higher.
The charts confirm this: while the main stock indices rose yesterday, AAPL shares fell by around 1.5%.
Technical Analysis of Apple Shares (AAPL)
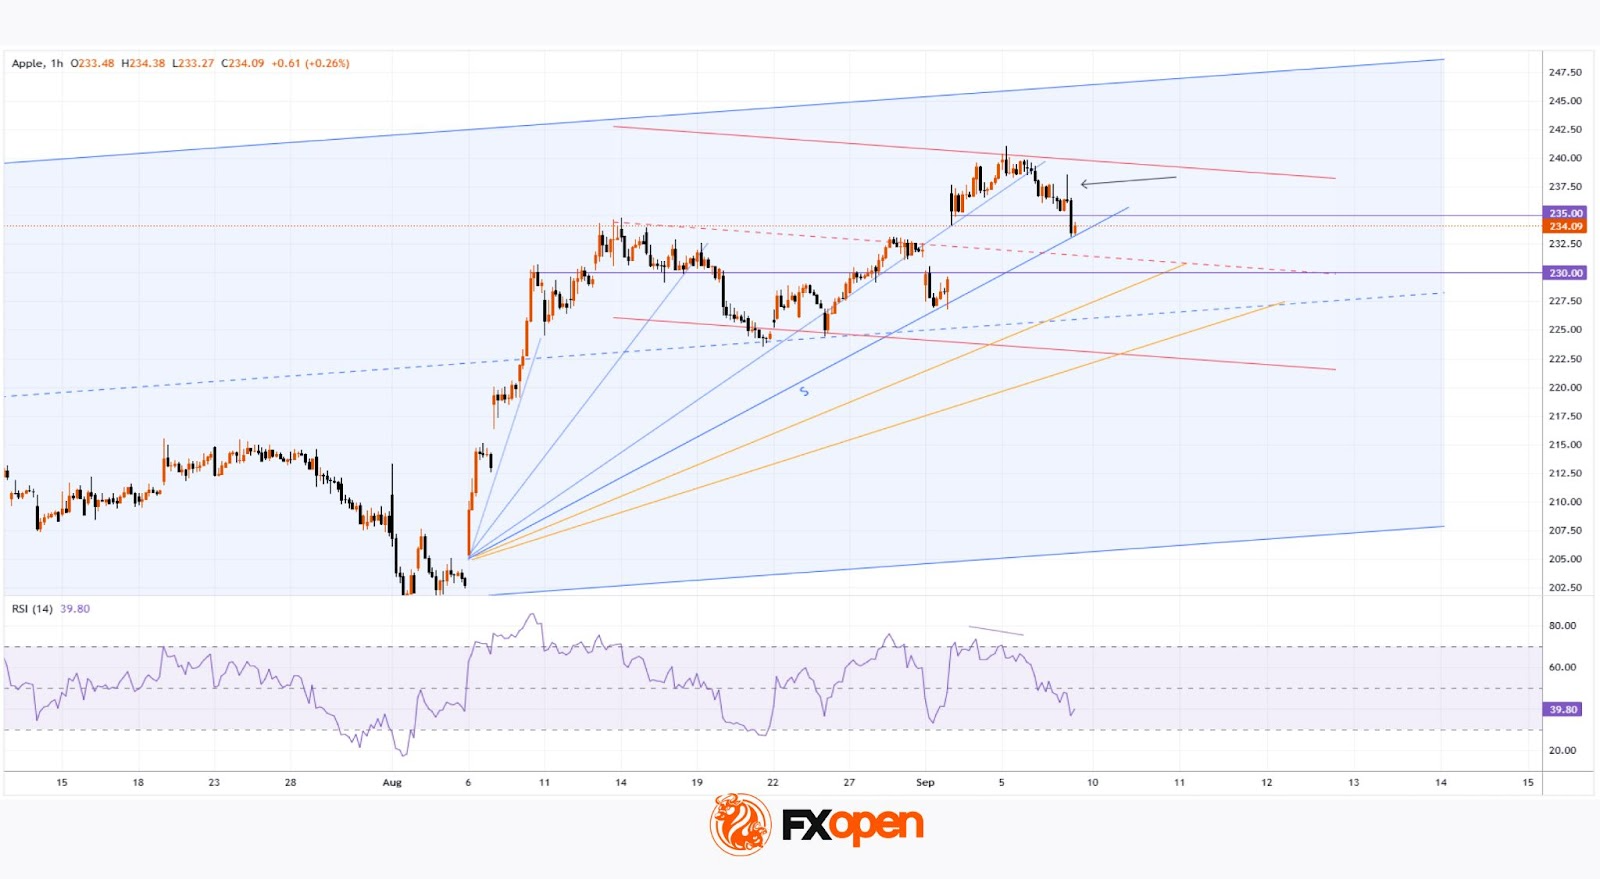
When analysing the chart six days ago, we:
→ confirmed the upward channel (shown in blue);
→ highlighted the $235 support level;
→ suggested that while AAPL stock could maintain upward momentum, disappointment over the new product launch might trigger a correction.
In addition to the AAPL price action we noted earlier, several bearish signals on the hourly chart support the correction scenario:
→ a long upper shadow (marked with an arrow);
→ aggressive price action when breaking the $235 support;
→ bearish divergences on the RSI indicator.
Bulls might find support at line S, which is part of a fan drawn from the starting point of the bullish impulse on 6 August.
However, if bearish sentiment persists, price action could unfold within the structure shown in red (potentially a bull flag pattern inside the prevailing bullish trend). Bearish pressure could aim to push AAPL shares down towards the median of the red channel.
In that case, bulls may find support in the area where several lines converge:
→ the lower rays of the fan (shown in orange);
→ the psychological $230 level (which has repeatedly switched roles between resistance and support since August);
→ the median of the blue channel;
→ the lower boundary of the bullish gap from 2 September.
Buy and sell stocks of the world's biggest publicly-listed companies with CFDs on FXOpen’s trading platform. Open your FXOpen account now or learn more about trading share CFDs with FXOpen.
This article represents the opinion of the Companies operating under the FXOpen brand only. It is not to be construed as an offer, solicitation, or recommendation with respect to products and services provided by the Companies operating under the FXOpen brand, nor is it to be considered financial advice.
Stay ahead of the market!
Subscribe now to our mailing list and receive the latest market news and insights delivered directly to your inbox.


Latest articles

Natural Gas: key support amid renewed escalation
A key development on 13 April was the start of a naval blockade of Iranian ports, a direct consequence of the collapse of negotiations in Islamabad on 12 April. The blockade covers all vessels entering and leaving Iranian ports in

European Currencies Advance Amid Shifting Geopolitical Outlook
The initial rise in EUR/USD and GBP/USD was driven by reports of a temporary ceasefire between the United States and Iran, which reduced demand for the US dollar as a safe-haven asset. However, over the weekend, reports emerged

Market Analysis: GBP/USD Holds Firm, USD/CAD Bulls Target Breakout Move
GBP/USD started a downside correction from 1.3480. USD/CAD is gaining bullish momentum and might clear 1.3880 for more upside.
Important Takeaways for GBP/USD and USD/CAD Analysis Today
· The British Pound rallied toward 1.3500