


AUD/USD Analysis: Aussie Weakens After RBA Decision
FXOpen

Following its decision on 7th May, the Reserve Bank of Australia (RBA) opted to maintain the interest rate at 4.35%, despite inflation continuing to decrease at a slower pace than anticipated by the RBA.
"I think we still think they’re reasonably balanced with perhaps a little bit of a signal that we need to be very watchful on the upside," RBA governor Michele Bullock said.
According to The Guardian, the absence of more aggressive language led to a decline in the Australian dollar.
Specifically, on the morning of 8th May, the AUD/USD rate fell below the 0.657 level, whereas on 7th May, the rate was at 0.664 - a decrease of approximately 1.3% in 30 hours.
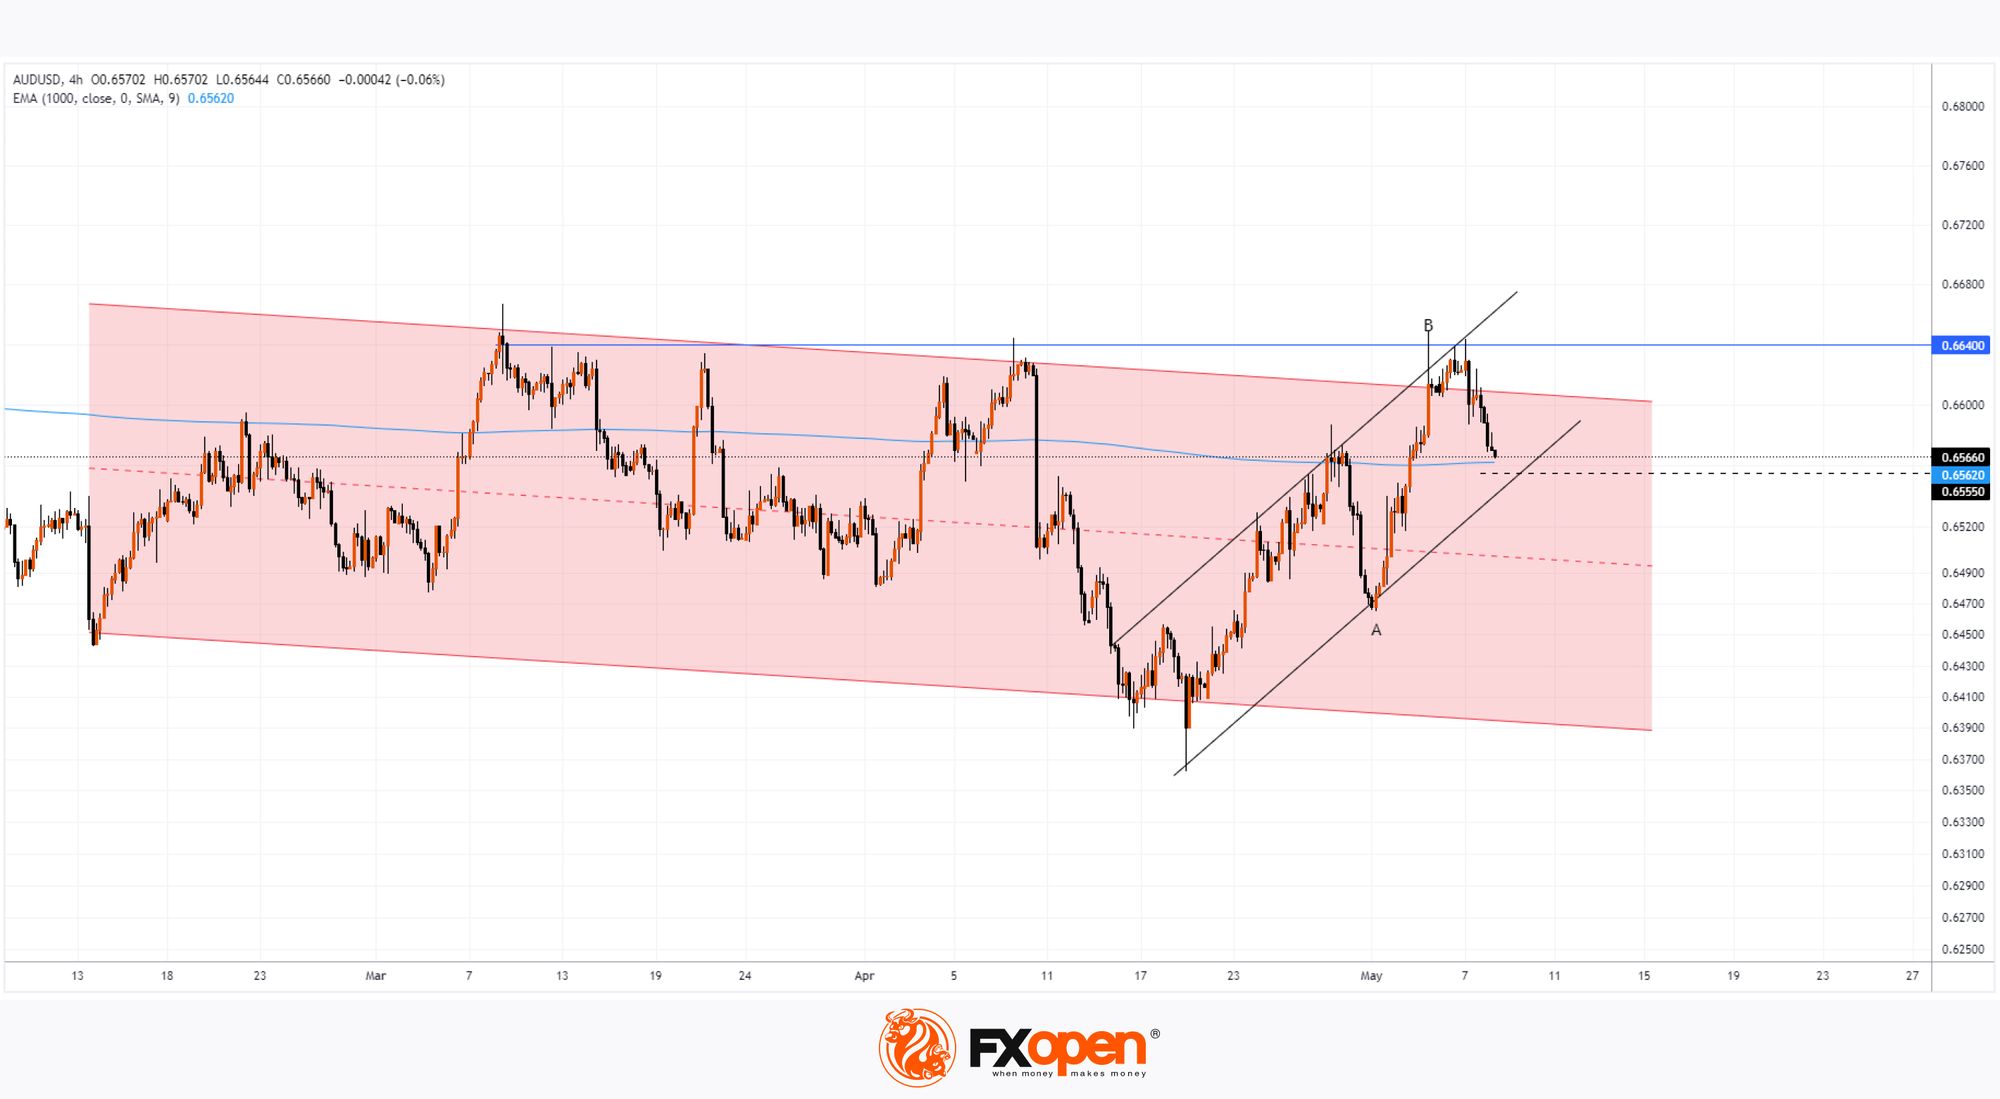
Technical analysis of the AUD/USD chart indicates that:
→ The 0.664 level serves as a significant resistance - the price turned down from this level several times since March;
→ The price may continue to decline, staying within the channel shown in red.
Current bearish sentiments point towards a potential decline in the AUD/USD price towards the median line of the red channel. Support may be found around the 0.6555 level, where:
→ The lower boundary of the intermediate rising channel (shown in black);
→ 50% correction level from the bull impulse A→B. → EMA (100).
The near-term fluctuations in the AUD/USD exchange rate (as well as other financial assets denominated in USD) could be influenced by comments from Federal Reserve representatives expected on Thursday and Friday.
Trade over 50 forex markets 24 hours a day with FXOpen. Take advantage of low commissions, deep liquidity, and spreads from 0.0 pips (additional fees may apply). Open your FXOpen account now or learn more about trading forex with FXOpen.
This article represents the opinion of the Companies operating under the FXOpen brand only. It is not to be construed as an offer, solicitation, or recommendation with respect to products and services provided by the Companies operating under the FXOpen brand, nor is it to be considered financial advice.
Stay ahead of the market!
Subscribe now to our mailing list and receive the latest market news and insights delivered directly to your inbox.


Latest articles

AI Valuations Are Back in the Spotlight
Artificial intelligence remains the dominant investment theme of 2026, but investors are increasingly questioning whether AI stock valuations are keeping pace with reality.
💰 Big Tech continues to invest at an unprecedented scale, with hyperscaler AI spending projected to exceed $800

AUD/CAD: Months of Indecision — Is a Breakout Finally Coming?
The Australian dollar has clawed back most of its end-of-June losses, when it touched three-month lows against the greenback amid escalating Middle East tensions. Since then, sentiment has improved: the RBA's Assistant Governor Sarah Hunter signalled the board stands ready

USD/JPY: Battling at the Top of the Triangle
On 3 July, Japan's Finance Minister, Satsuki Katayama, stated that the Ministry of Finance remains in close contact with US authorities regarding developments in USD/JPY as the yen traded near its weakest level in almost 40 years. Similar verbal