


AUD/USD Analysis: The Rate Reacts Sharply to News About Inflation
FXOpen
Today in Australia, data from the CPI indicator was published, which came as an unpleasant surprise, indicating that inflation in Australia does not want to decline:
Core Price Index was: actual = 5.6%, expected = 5.3%, a month earlier = 5.2%, two months earlier = 4.9%.
Perhaps the reason that inflation is raising its head again is high prices on the world oil market.
One way or another, the AUD/USD chart shows a surge in volatility and a sharp downward reversal from the level of 0.63900. The multidirectionality of impulses may indicate that the news was indeed unexpected.
According to Reuters, two of Australia's four largest banks — the Commonwealth Bank of Australia and ANZ — now expect a quarter-point rate hike in November. “While the current level of 4.35% could mark the peak of the cash rate, there is a risk that policy could tighten further. Any easing is still a long way off,” bank analysts say.
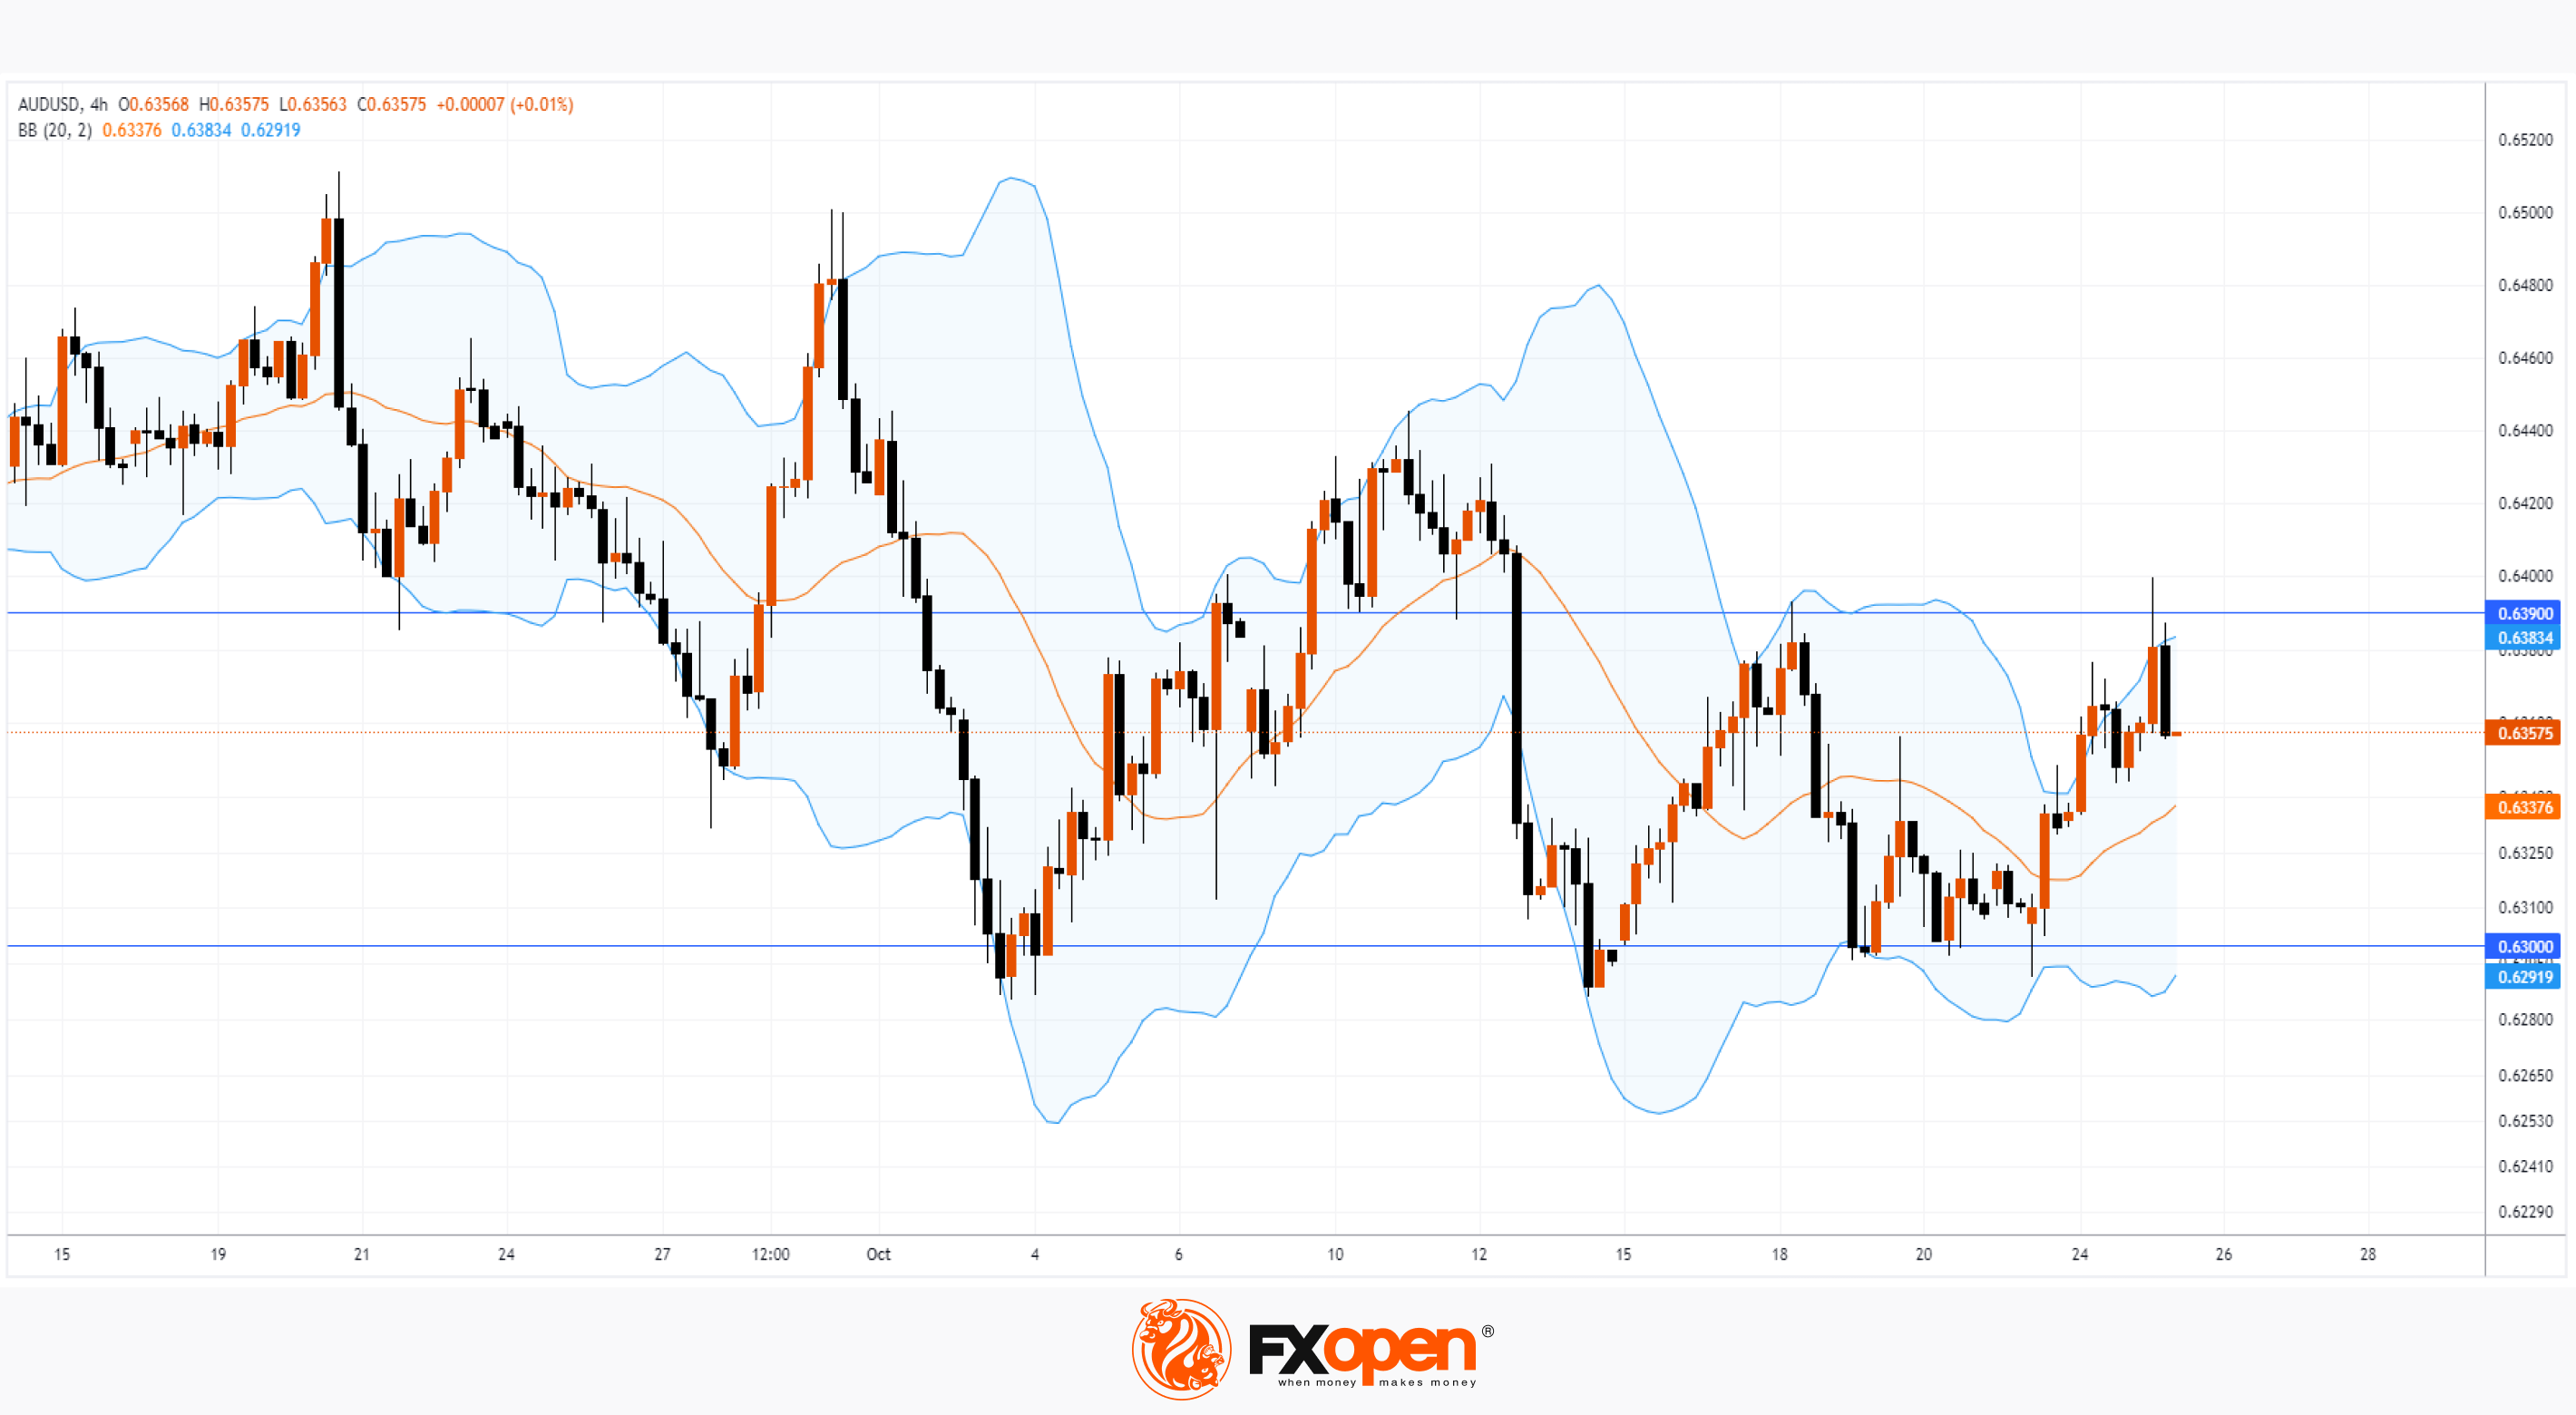
Meanwhile, the last two candles on the chart show the change in sentiment today. At the same time, the price returned to the channel formed by Bollinger bands.
It is possible that:
→ candles will complete the formation of a bearish engulfing pattern;
→ the momentum will continue, and the price will drop to the lower Bollinger band, where there is important support at 0.630. Note that in the fall of 2022, large trading volumes were recorded at this level, from which the AUD/USD rate rose sharply to a maximum of 2023. Surely, the level of 0.630 is important from a fundamental point of view.
Note that a speech by the head of the Central Bank of Australia is scheduled for tomorrow 01:00 GMT+3, whose statements may cause new impulses.
Trade over 50 forex markets 24 hours a day with FXOpen. Take advantage of low commissions, deep liquidity, and spreads from 0.0 pips (additional fees may apply). Open your FXOpen account now or learn more about trading forex with FXOpen.
This article represents the opinion of the Companies operating under the FXOpen brand only. It is not to be construed as an offer, solicitation, or recommendation with respect to products and services provided by the Companies operating under the FXOpen brand, nor is it to be considered financial advice.
Stay ahead of the market!
Subscribe now to our mailing list and receive the latest market news and insights delivered directly to your inbox.


Latest articles

Dow Jones (DJIA): Consolidation Beyond the Trend
Federal Reserve Chair Kevin Warsh testified before Congress on 14–15 July, reaffirming the Fed's commitment to bringing inflation back to target while providing no clear guidance on the future path of interest rates. Meanwhile, June inflation data came in

European Currencies Strengthen Ahead of Key Macroeconomic Releases
EUR/USD and GBP/USD continue to recover moderately following the recent weakening of the US dollar. European currencies have been supported by expectations that US inflationary pressures will continue to ease after softer-than-expected CPI and PPI data, reinforcing market

Brent Crude Oil: From Ceasefire to Crossfire — What's Next?
Just weeks ago, traders were pricing in peace. Now they're pricing in war again—and that reversal says everything about how fragile the current Middle East calm really is.
Brent crude has surged to $86 a barrel, its highest level