


AUD/USD Analysis: US Dollar Rebounds from Decline
FXOpen

Yesterday, the PMI Manufacturing indices for several countries were published. The news turned out to be disappointing for the US - according to ForexFactory:
→ Final Manufacturing PMI: actual = 51.3; expected = 50.9; previous value = 50.9;
→ ISM Manufacturing PMI: actual = 48.7; expected = 49.8; previous value = 49.2;
This led to a weakening of the US dollar yesterday, as the not-so-strong manufacturing activity data, as reported by Trading Economics, supported arguments in favor of the Federal Reserve lowering interest rates.
As a result, currencies of other countries strengthened against the dollar, notably the AUD/USD exchange rate rose above 0.669 - the highest level in 2 weeks.
However, today the US Dollar is rebounding from yesterday's decline - and this is more clearly visible on the AUD/USD chart, indicating potential internal weakness for the Australian dollar.
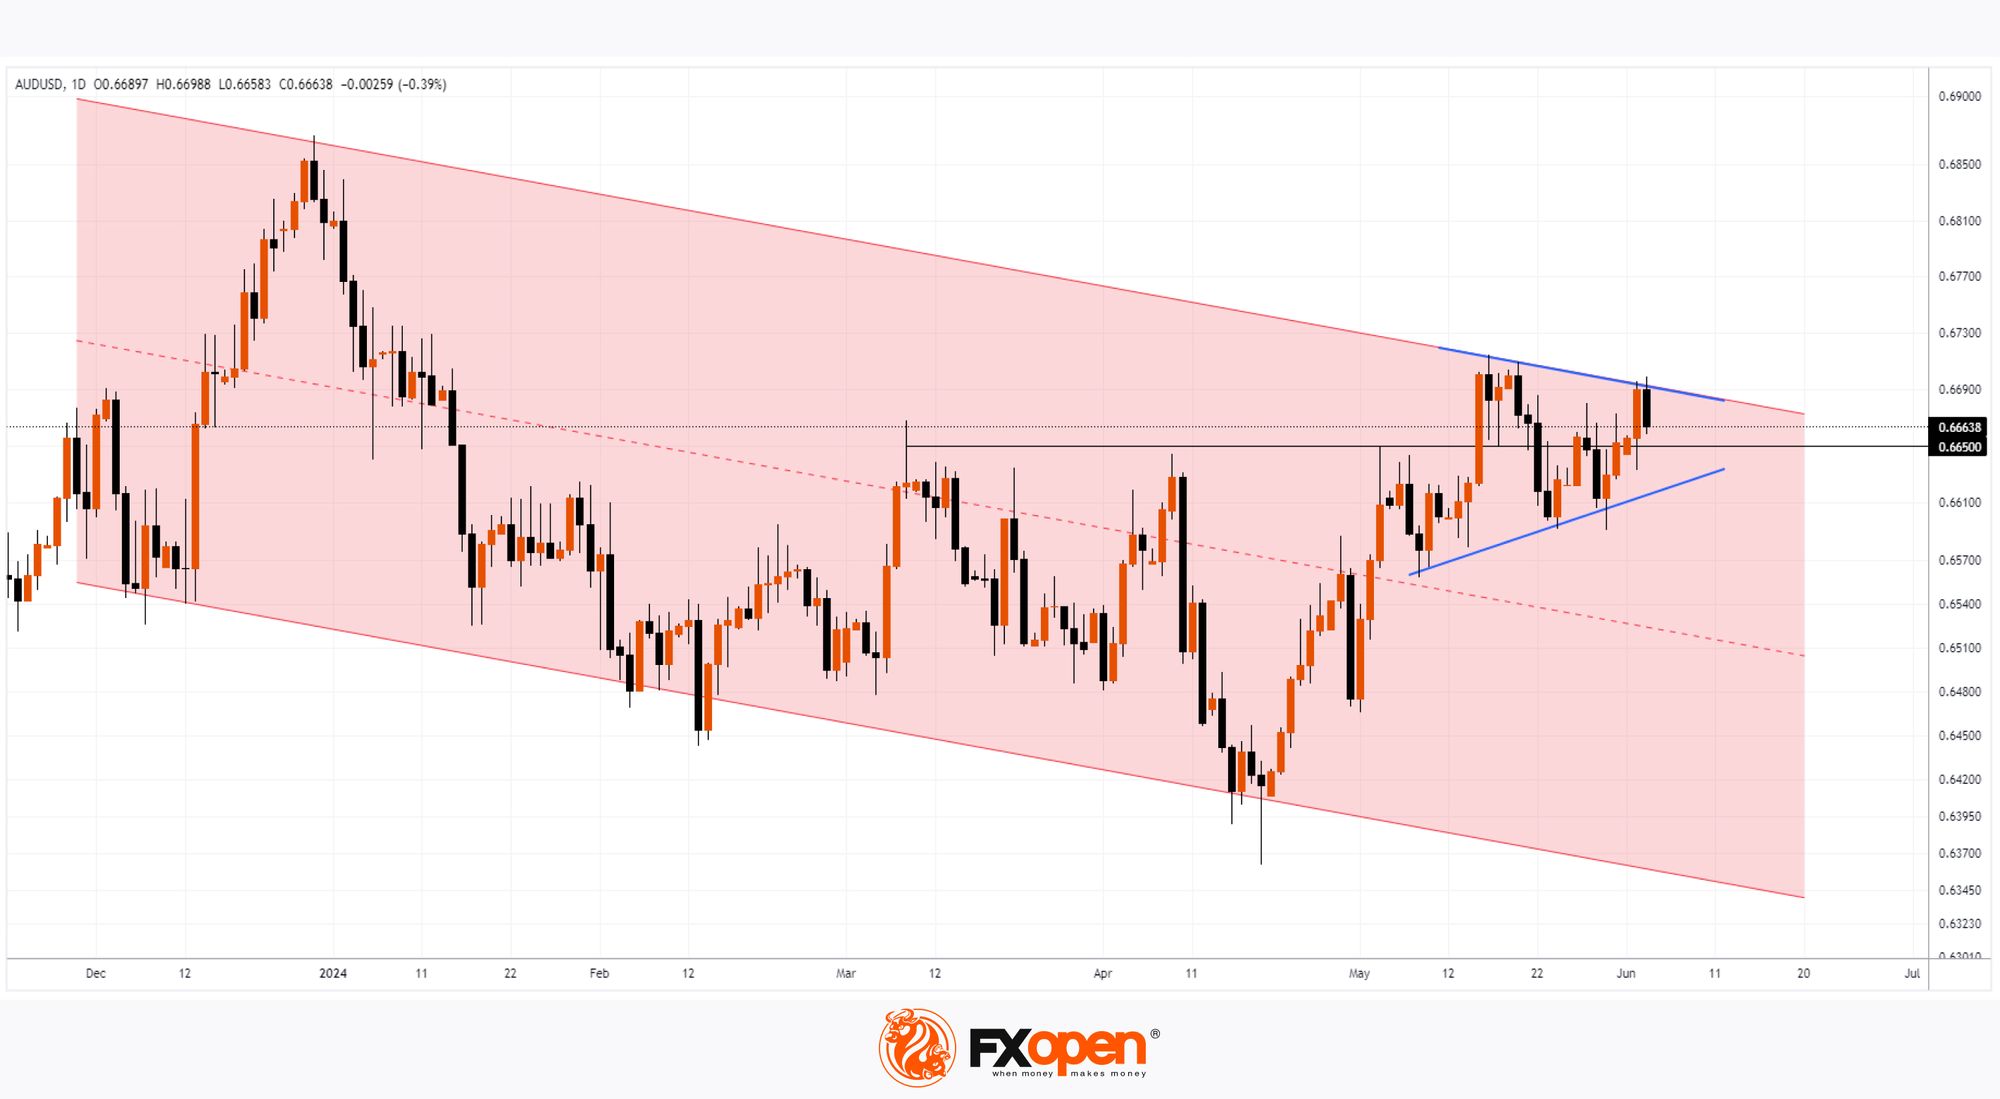
Technical analysis of the daily chart of AUD/USD shows that:
→ since the end of 2023, the market has been in a downtrend (indicated by the red channel);
→ the AUD/USD price is near the upper boundary of this channel;
→ price action is forming a symmetrical triangle pattern (shown by the blue lines), which usually indicates a temporary balance between supply and demand forces. In this case, it could be interpreted as demand exhaustion after a rise of approximately 2.75% in May;
→ the key level of 0.665, which acted as resistance since March, now serves as the central axis of the mentioned triangle;
→ yesterday's and today's (not yet closed) candles may form a bearish engulfing pattern, indicating ongoing selling pressure above the 0.668 level.
It is possible that during June, bears will attempt to break downwards from the consolidation triangle and resume the prevailing downtrend in the AUD/USD market. A key driver for this scenario to unfold will be the FOMC meeting scheduled for June 12th.
Trade over 50 forex markets 24 hours a day with FXOpen. Take advantage of low commissions, deep liquidity, and spreads from 0.0 pips (additional fees may apply). Open your FXOpen account now or learn more about trading forex with FXOpen.
This article represents the opinion of the Companies operating under the FXOpen brand only. It is not to be construed as an offer, solicitation, or recommendation with respect to products and services provided by the Companies operating under the FXOpen brand, nor is it to be considered financial advice.
Stay ahead of the market!
Subscribe now to our mailing list and receive the latest market news and insights delivered directly to your inbox.


Latest articles

AI Valuations Are Back in the Spotlight
Artificial intelligence remains the dominant investment theme of 2026, but investors are increasingly questioning whether AI stock valuations are keeping pace with reality.
💰 Big Tech continues to invest at an unprecedented scale, with hyperscaler AI spending projected to exceed $800

AUD/CAD: Months of Indecision — Is a Breakout Finally Coming?
The Australian dollar has clawed back most of its end-of-June losses, when it touched three-month lows against the greenback amid escalating Middle East tensions. Since then, sentiment has improved: the RBA's Assistant Governor Sarah Hunter signalled the board stands ready

USD/JPY: Battling at the Top of the Triangle
On 3 July, Japan's Finance Minister, Satsuki Katayama, stated that the Ministry of Finance remains in close contact with US authorities regarding developments in USD/JPY as the yen traded near its weakest level in almost 40 years. Similar verbal