


Bitcoin Price Rises to Its Highest Level Since 24 August
FXOpen

On 1 September, in the article Bitcoin Price Chart Analysis: Are the Bulls Lifting Their Heads?, we:
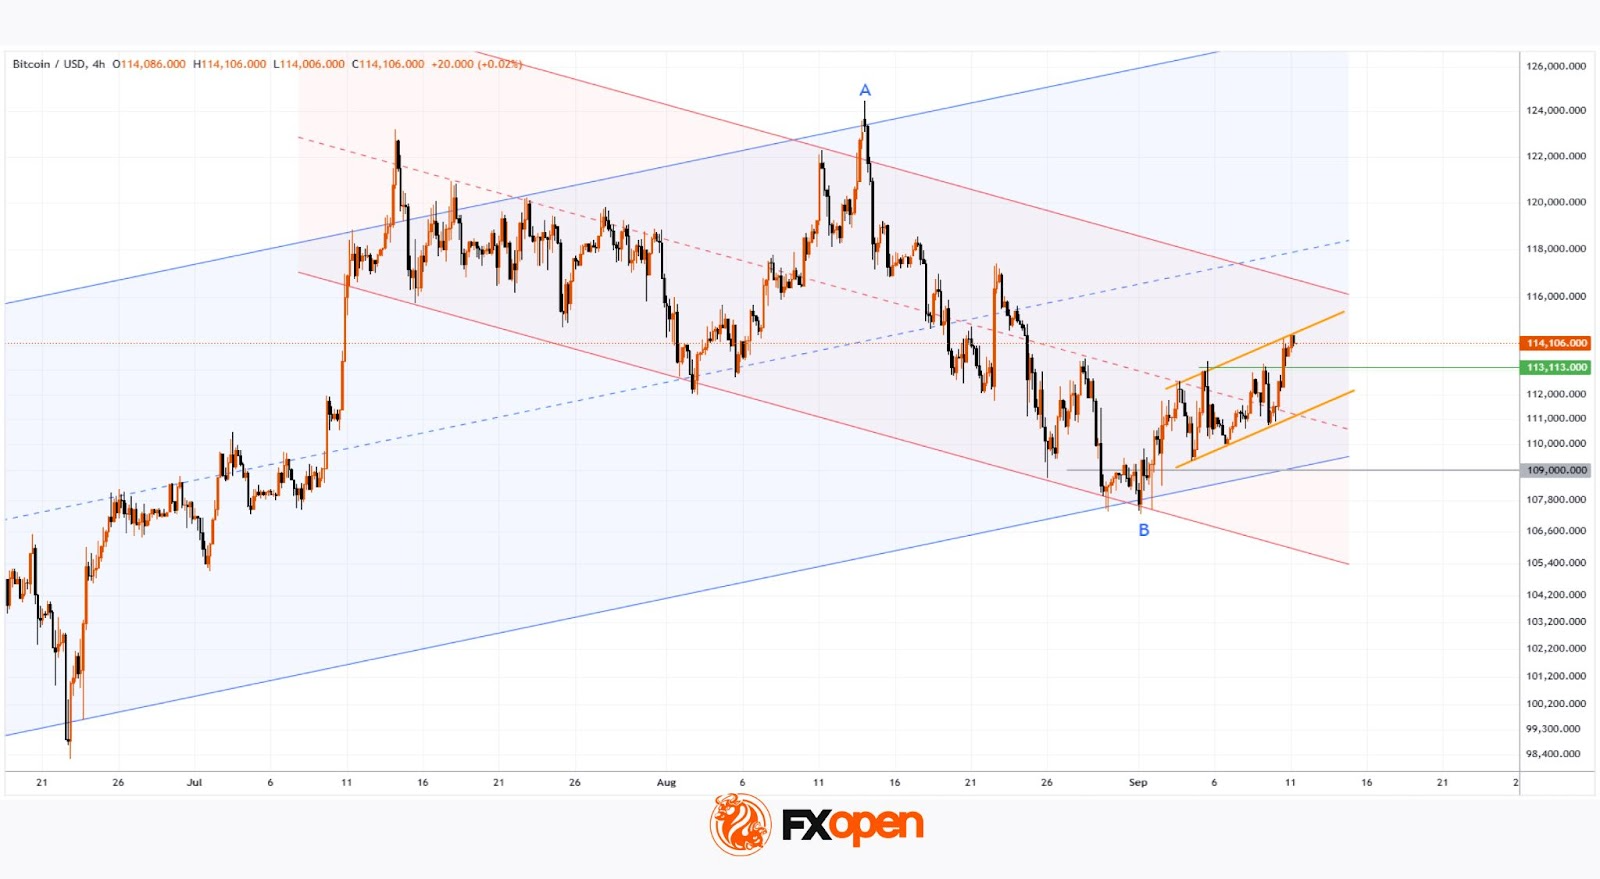
→ drew a long-term upward (blue) and short-term downward (red) channel;
→ highlighted a series of bullish signals and suggested that the price could climb towards the median of the red channel.
Indeed, since then Bitcoin’s price has not only reached the median of the red channel but has also moved into its upper half. Since the start of the month, the leading cryptocurrency has gained more than 5%.
Why Is Bitcoin Rising?
The main factors include:
→ Expectations of US Federal Reserve rate cuts, which create favourable conditions for risk assets.
→ News of a strategic partnership between Nasdaq and crypto exchange Gemini.
→ Inflows of corporate investment. For example, Metaplanet announced plans for large-scale Bitcoin purchases.
→ Reduced regulatory uncertainty has also played an important role, with SEC leadership statements in support of innovation being welcomed by the market.
Technical Analysis of the BTC/USD Chart
The chart suggests that Bitcoin’s price is still in a corrective phase (marked by the red channel) within the broader uptrend. In other words, we may be “inside” a bull flag pattern, with the potential for renewed growth within the blue channel in the coming weeks.
From a bullish perspective:
→ demand is showing strength, as the price has reached its highest level since 24 August;
→ higher highs and higher lows form a steady upward trajectory, marked by orange lines, with the lower one potentially continuing to act as support in the coming days;
→ the red median, once broken, may now serve as support, along with the former local resistance at $113,113.
From a bearish perspective, Bitcoin’s price has approached key resistance levels:
→ the upper boundary of the red channel;
→ the psychological mark of $115,000;
→ the 50% retracement level of the A→B impulse, around $116k.
Taking the above into account, we could assume that the bulls still hold the upper hand, though their momentum may be weakening. We might see BTC/USD consolidating near the $115k level, with a decisive shift in sentiment potentially occurring next week, when several central banks are set to announce interest rate decisions.
FXOpen offers the world's most popular cryptocurrency CFDs*, including Bitcoin and Ethereum. Floating spreads, 1:2 leverage — at your service (additional fees may apply). Open your trading account now or learn more about crypto CFD trading with FXOpen.
*Important: At FXOpen UK, Cryptocurrency trading via CFDs is only available to our Professional clients. They are not available for trading by Retail clients. To find out more information about how this may affect you, please get in touch with our team.
This article represents the opinion of the Companies operating under the FXOpen brand only. It is not to be construed as an offer, solicitation, or recommendation with respect to products and services provided by the Companies operating under the FXOpen brand, nor is it to be considered financial advice.
Stay ahead of the market!
Subscribe now to our mailing list and receive the latest market news and insights delivered directly to your inbox.


Latest articles


Market Repricing of Risk as Gold Loses Safe-Haven Demand
Geopolitical tensions in the Middle East had remained the primary macro driver for the gold market over recent weeks; however, on 8 April the situation shifted sharply as the United States and Iran agreed to a temporary two-week ceasefire, including

Commodity Currencies on the Rise: Market Focus Shifts to US and Canadian Data
Commodity-linked currencies continue to strengthen, while the US dollar remains under pressure amid easing geopolitical tensions and a shift in investor preference towards riskier assets. Reports of a temporary ceasefire between the US and Iran have helped stabilise sentiment and