


FXOpen

The XBR/USD chart reveals that Brent crude oil is trading near its lowest levels of the year.
Several factors are pressuring oil prices:
→ China's uncertain demand outlook: As the world's largest crude oil importer, any signs of weakening demand weigh heavily on the market.
→ A strengthening US dollar: Since Brent is priced in USD, a stronger dollar makes oil more expensive for international buyers, dampening demand.
→ Trump's promises to halt wars, including in the Middle East: This reduces geopolitical risk, which traditionally acts as a bullish factor for oil prices.
Technical Analysis of XBR/USD
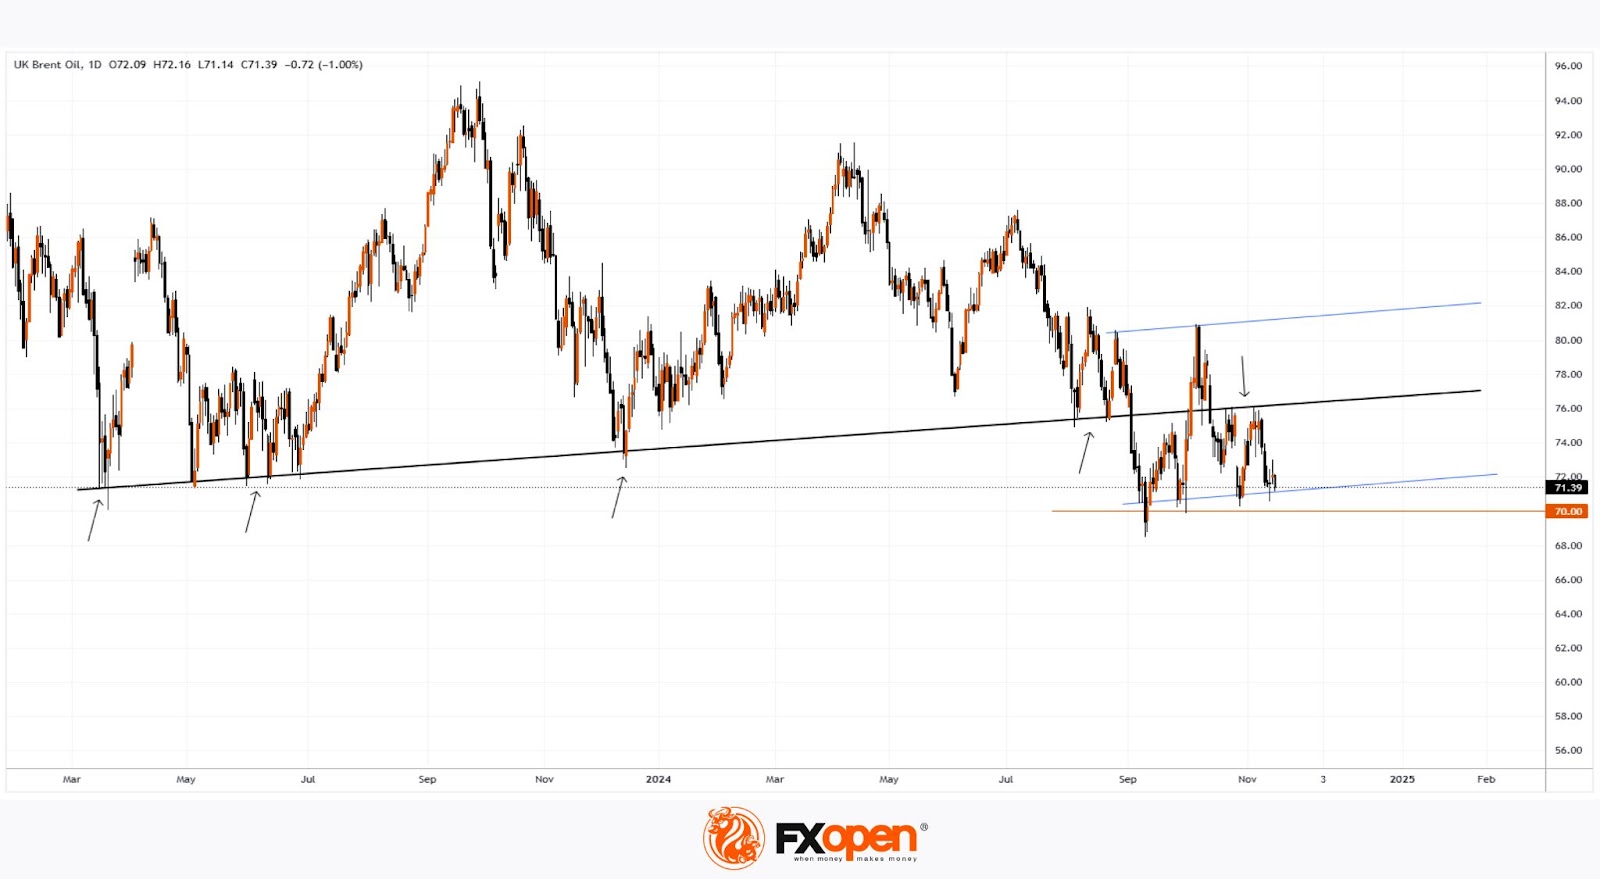
From a technical perspective, bears appear to maintain control as a key trendline has shifted from acting as support to resistance (as indicated by the arrows on the chart).
Currently, the price oscillates around this trendline, which serves as the median of a channel marked by blue boundaries:
→ The upper boundary has been tested only once.
→ The lower boundary is under consistent pressure. Bulls, however, have managed to keep the price above the psychological $70.00 level.
How long can demand forces sustain Brent above $70? A fresh bearish breakout below this level could occur, testing whether buyers can prevent the market from extending its downtrend, which has persisted since April 2024.
Start trading commodity CFDs with tight spreads (additional fees may apply). Open your trading account now or learn more about trading commodity CFDs with FXOpen.
This article represents the opinion of the Companies operating under the FXOpen brand only. It is not to be construed as an offer, solicitation, or recommendation with respect to products and services provided by the Companies operating under the FXOpen brand, nor is it to be considered financial advice.
Stay ahead of the market!
Subscribe now to our mailing list and receive the latest market news and insights delivered directly to your inbox.


Latest articles

Market Analysis: GBP/USD Dips Further As EUR/GBP Regains Traction
GBP/USD failed to climb above 1.3500 and corrected some gains. EUR/GBP started a decent increase and might aim for more gains above 0.8700.
Important Takeaways for GBP/USD and EUR/GBP Analysis Today
· The British Pound


Market Insights with Gary Thomson: Oil, US Retail Sales & NFP in Focus
In this video, we’ll explore the key economic events and market trends, shaping the financial landscape. Get ready for insights into financial markets to help you navigate the week ahead. Let’s dive in!
In this episode of Market