


FXOpen

When analysing the oil market on the XBR/USD chart on 4th September, with Brent crude trading near its yearly low, we:
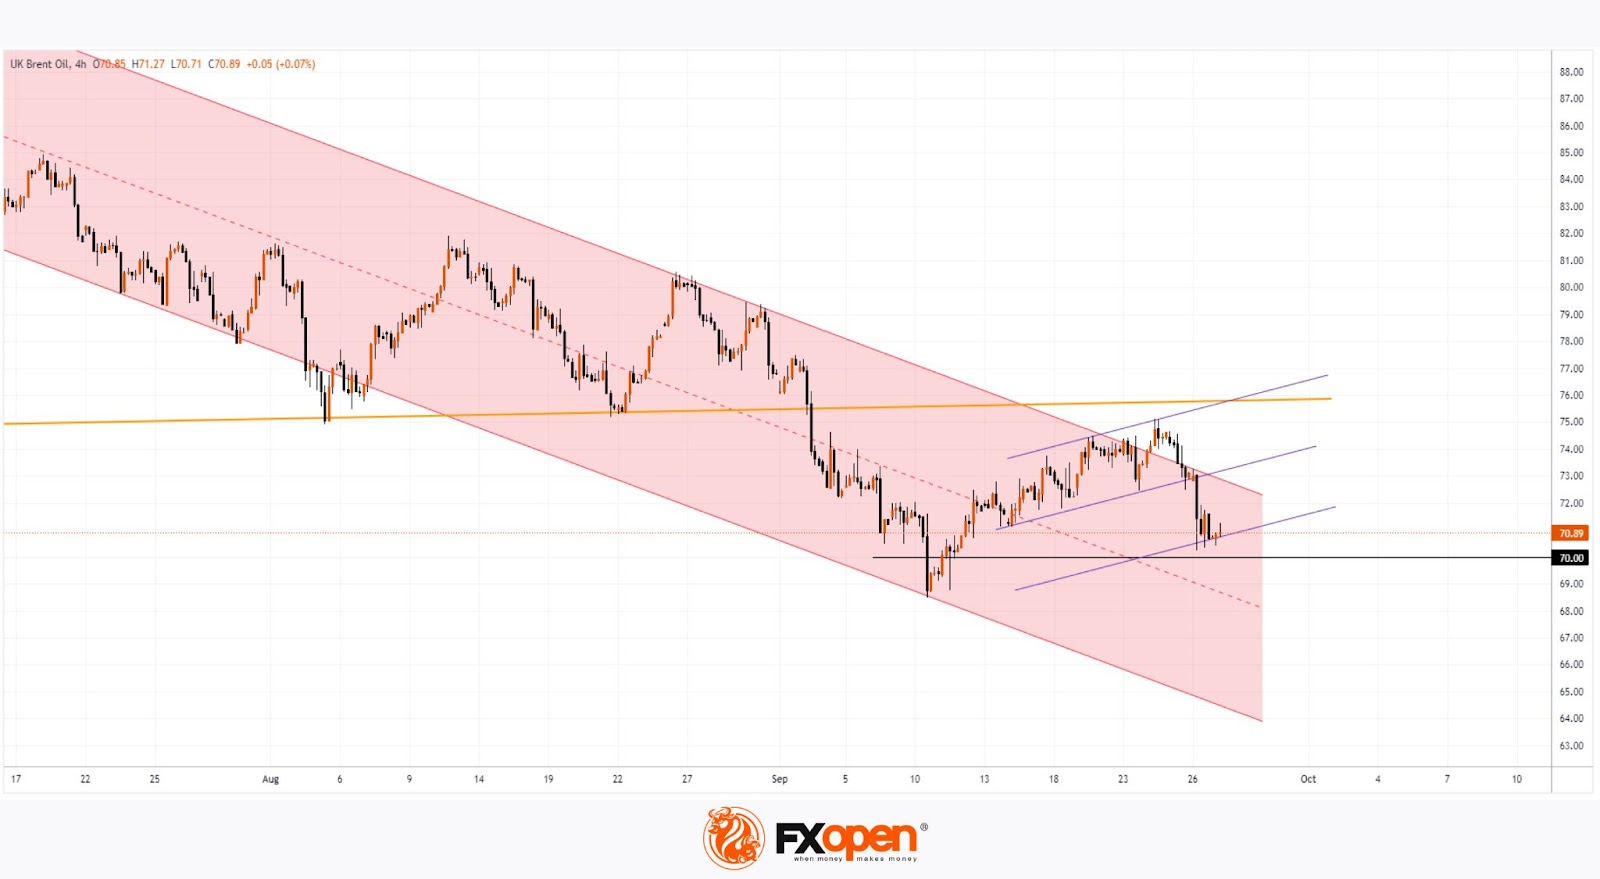
→ noted the formation of a descending channel (marked in red);
→ highlighted key support (marked in yellow), which has now been broken;
→ suggested the likelihood of an interim upward correction, potentially rising to $74.50.
Since then, Brent crude oil:
→ climbed to $75;
→ tested the yellow line from below;
→ then reversed downwards, reaffirming the relevance of the red descending channel (as the bullish breakout attempt failed).
Bearish sentiment was fuelled by reports of a potential increase in global oil supply, particularly due to higher production in Libya and Saudi Arabia.
Could Brent crude prices continue to fall?
From a technical analysis perspective of the XBR/USD chart today:
→ The price is in the upper half of the descending channel, indicating that while bears may control the market, it may not be enough to expect a sustained downward trend.
→ Bulls appear to be active as the price nears the psychological level of $70. This was evident with yesterday’s halt in the price decline around $70.60.
→ Price dynamics are revealing clearer signs of an upward channel (shown by the purple lines).
Considering the above, we cannot rule out the possibility of Brent crude making another attempt to break through the upper boundary of the red channel in the near future.
Start trading commodity CFDs with tight spreads (additional fees may apply). Open your trading account now or learn more about trading commodity CFDs with FXOpen.
This article represents the opinion of the Companies operating under the FXOpen brand only. It is not to be construed as an offer, solicitation, or recommendation with respect to products and services provided by the Companies operating under the FXOpen brand, nor is it to be considered financial advice.
Stay ahead of the market!
Subscribe now to our mailing list and receive the latest market news and insights delivered directly to your inbox.


Latest articles

Market Analysis: GBP/USD Dips Further As EUR/GBP Regains Traction
GBP/USD failed to climb above 1.3500 and corrected some gains. EUR/GBP started a decent increase and might aim for more gains above 0.8700.
Important Takeaways for GBP/USD and EUR/GBP Analysis Today
· The British Pound


Market Insights with Gary Thomson: Oil, US Retail Sales & NFP in Focus
In this video, we’ll explore the key economic events and market trends, shaping the financial landscape. Get ready for insights into financial markets to help you navigate the week ahead. Let’s dive in!
In this episode of Market