


FXOpen

Analyzing the oil market on the XBR/USD chart from August 26, when Brent crude was trading around $79 per barrel, we observed the following:
→ The price was forming a descending channel (shown in red) and approaching its upper boundary, which could act as resistance.
→ We identified a key support level (shown in yellow).
→ We suggested that the bulls would need to prove their determination when facing a block of resistance around the $80 level.
Since then, Brent crude oil has:
→ Reversed downward, failing to hold above the $80 level, and continued to decline within the red channel.
→ Accelerated its decline, breaking through the key support around the $75 level.
Bearish sentiment was fueled by OPEC+ plans to increase oil production, signaling a shift away from production cuts aimed at maintaining higher prices.
Could Brent Crude Oil Continue to Decline?
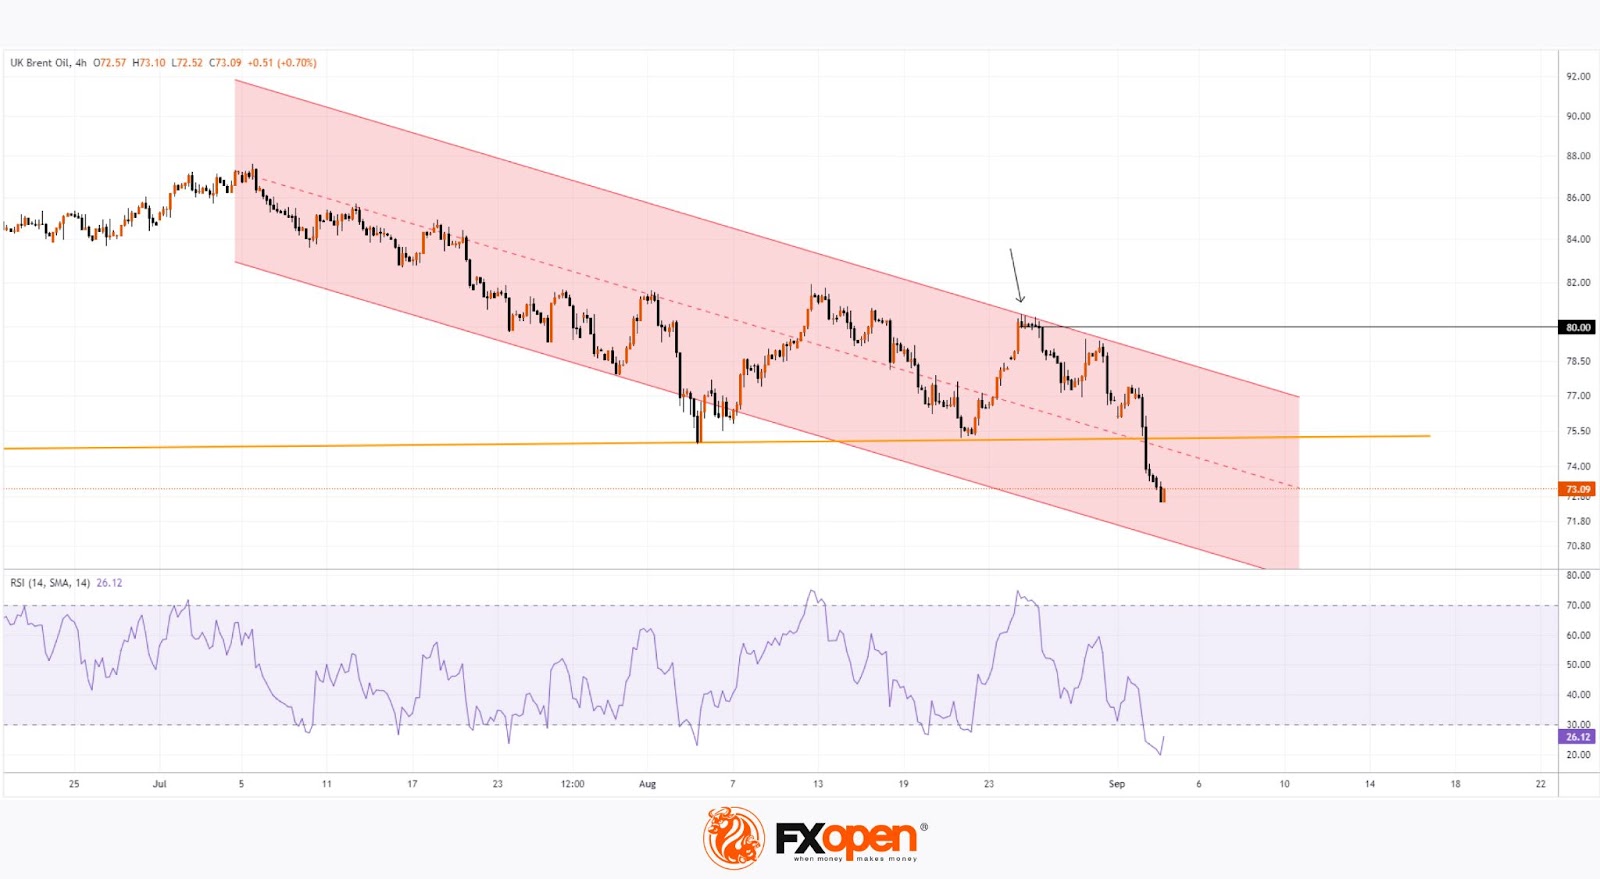
From a technical analysis perspective, the XBR/USD chart today indicates that supply forces are asserting their dominance, as the price has fallen into the lower half of the red channel, with the RSI indicator entering oversold territory.
After a roughly 10% decline in Brent crude oil prices since last Monday, the prospect of an interim upward correction seems plausible.
However, given the above, a significant resistance block appears to be around the $74.50 area, where:
→ The median line of the red channel is located.
→ The yellow line, which served as support for several months, is likely to act as resistance after being breached.
In the worst-case scenario, Brent crude oil could drop to the lower boundary of the channel, approaching the psychological level of $70.
Start trading commodity CFDs with tight spreads (additional fees may apply). Open your trading account now or learn more about trading commodity CFDs with FXOpen.
This article represents the opinion of the Companies operating under the FXOpen brand only. It is not to be construed as an offer, solicitation, or recommendation with respect to products and services provided by the Companies operating under the FXOpen brand, nor is it to be considered financial advice.
Stay ahead of the market!
Subscribe now to our mailing list and receive the latest market news and insights delivered directly to your inbox.


Latest articles

Market Analysis: GBP/USD Dips Further As EUR/GBP Regains Traction
GBP/USD failed to climb above 1.3500 and corrected some gains. EUR/GBP started a decent increase and might aim for more gains above 0.8700.
Important Takeaways for GBP/USD and EUR/GBP Analysis Today
· The British Pound


Market Insights with Gary Thomson: Oil, US Retail Sales & NFP in Focus
In this video, we’ll explore the key economic events and market trends, shaping the financial landscape. Get ready for insights into financial markets to help you navigate the week ahead. Let’s dive in!
In this episode of Market