


Brent Crude Oil Price Is Declining Amid De-Escalation in the Middle East
FXOpen

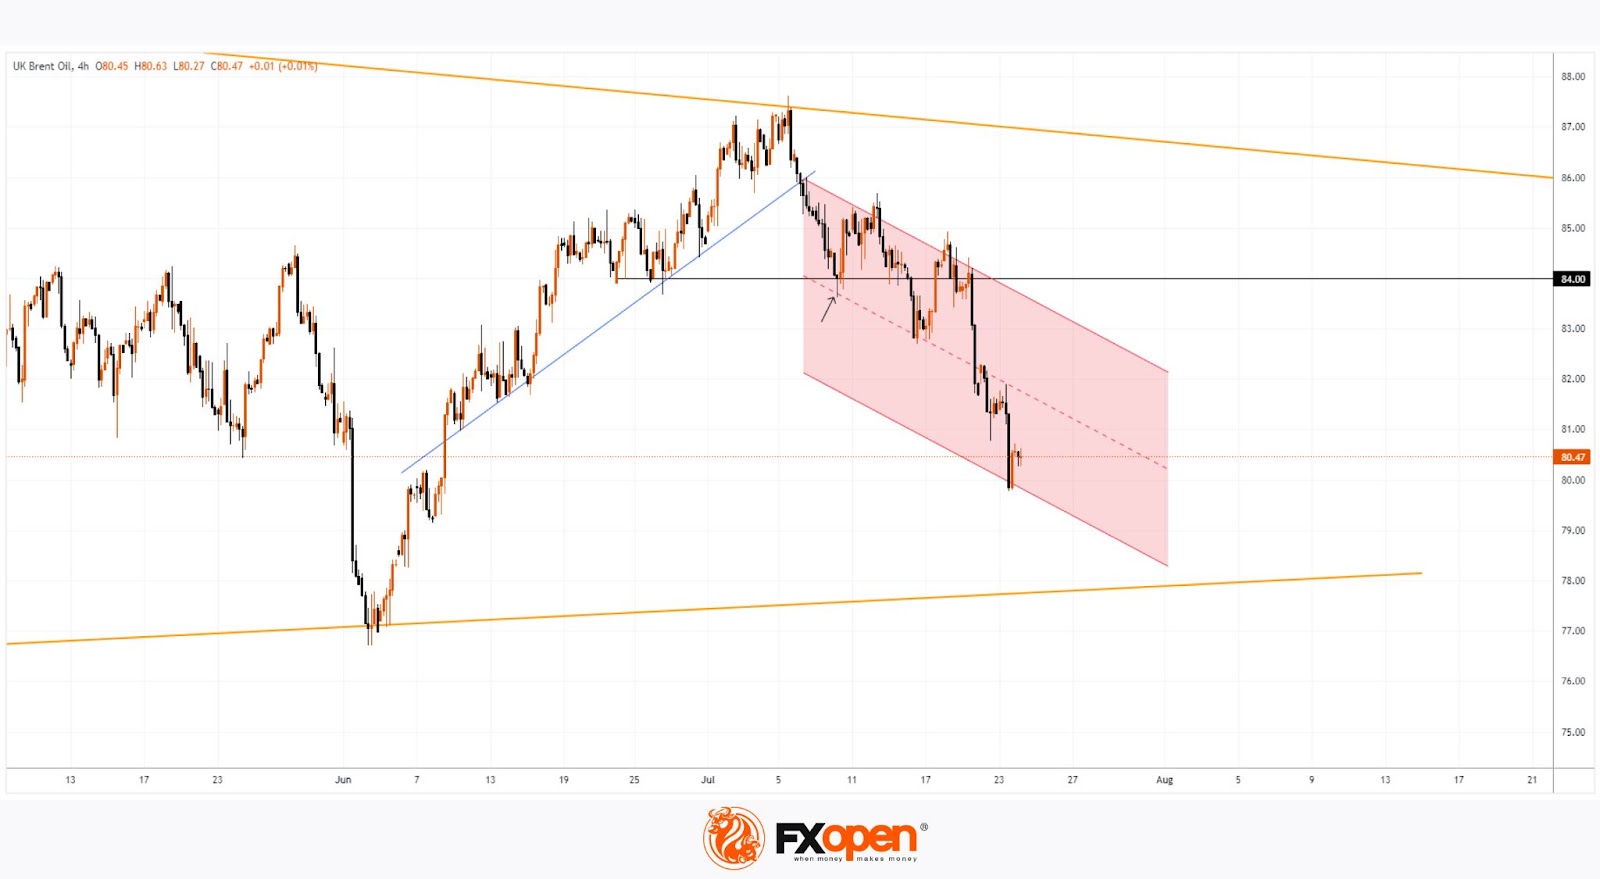
On 8th July, we noted that oil prices were forming a large narrowing triangle, originating from 2022-2023, with its upper boundary being a significant resistance point.
As shown on the Brent oil price chart (XBR/USD), bulls have since failed to overcome the upper boundary resistance around $87. Subsequently, the price:
→ turned downwards, breaking the blue upward trend line;
→ eventually breached the support level at $84, which we highlighted on 8th July;
→ Formed a descending channel (indicated in red).
Bearish sentiment is driven by:
→ news of increased oil inventories;
→ reduced tensions in the Middle East. Israeli Prime Minister Benjamin Netanyahu stated that an agreement with Hamas on hostage release is "maturing."
What’s next?
Technical analysis of the Brent oil price chart indicates:
→ The price is at the lower boundary of the red descending channel, which may provide support.
→ The accelerated decline since Friday has resulted in a loss of over 4%, potentially prompting bears to take profits.
In the short term, a bullish correction to the median line of the red channel is possible. The holiday season, currently in full swing, could also support oil demand.
What about the long term? Reuters reports an oil price forecast from Morgan Stanley analysts, according to which, although there is a clear deficit in the oil market, they expect that supply and demand will reach equilibrium by the fourth quarter, and by next year there could be a surplus, resulting in prices for grade oil Brent will fall closer to $70 per barrel. If accurate, this would mean the current narrowing triangle would be broken from the top down.
Start trading commodity CFDs with tight spreads (additional fees may apply). Open your trading account now or learn more about trading commodity CFDs with FXOpen.
This article represents the opinion of the Companies operating under the FXOpen brand only. It is not to be construed as an offer, solicitation, or recommendation with respect to products and services provided by the Companies operating under the FXOpen brand, nor is it to be considered financial advice.
Stay ahead of the market!
Subscribe now to our mailing list and receive the latest market news and insights delivered directly to your inbox.


Latest articles

GBP/USD and EUR/GBP Await Key Bank of England Decision
The pound strengthened following the outcome of the US Federal Reserve meeting, where the central bank, as expected, kept interest rates unchanged. However, the Fed did not provide the market with clear signals of an imminent shift towards rate cuts,

Microsoft Analysis: Earnings Beat Expectations
On 29 July 2026, Microsoft reported its results for the fourth quarter of fiscal year 2026. Revenue reached $90 billion, up 18% year-on-year, while adjusted earnings per share came in at $4.74, comfortably ahead of analysts' expectations of $4.

EUR/USD: All Eyes on the Fed as the Range Reaches Its Breaking Point
The dollar's next move hinges on tonight's Fed decision, and this time markets genuinely don't know what to expect. While economists still lean toward a hold—with CME FedWatch odds sitting near 68.5% for no change—Kevin Warsh's hawkish