


FXOpen

As indicated by the XBR/USD chart, the price per barrel opened at $80.28 on Friday and closed at $77.27 on Monday. Moreover, early Tuesday trading also shows a downward trend.
Bearish sentiment in the market is being influenced by geopolitical factors, particularly the easing of tensions in the Middle East. According to media reports, Israeli Prime Minister Benjamin Netanyahu has accepted a proposal aimed at resolving disagreements between Israel and Hamas.
Additionally, ANZ Bank analysts point to a reduction in petrol consumption in China due to the increasing use of electric vehicles.
Could Brent crude oil prices continue to fall further?
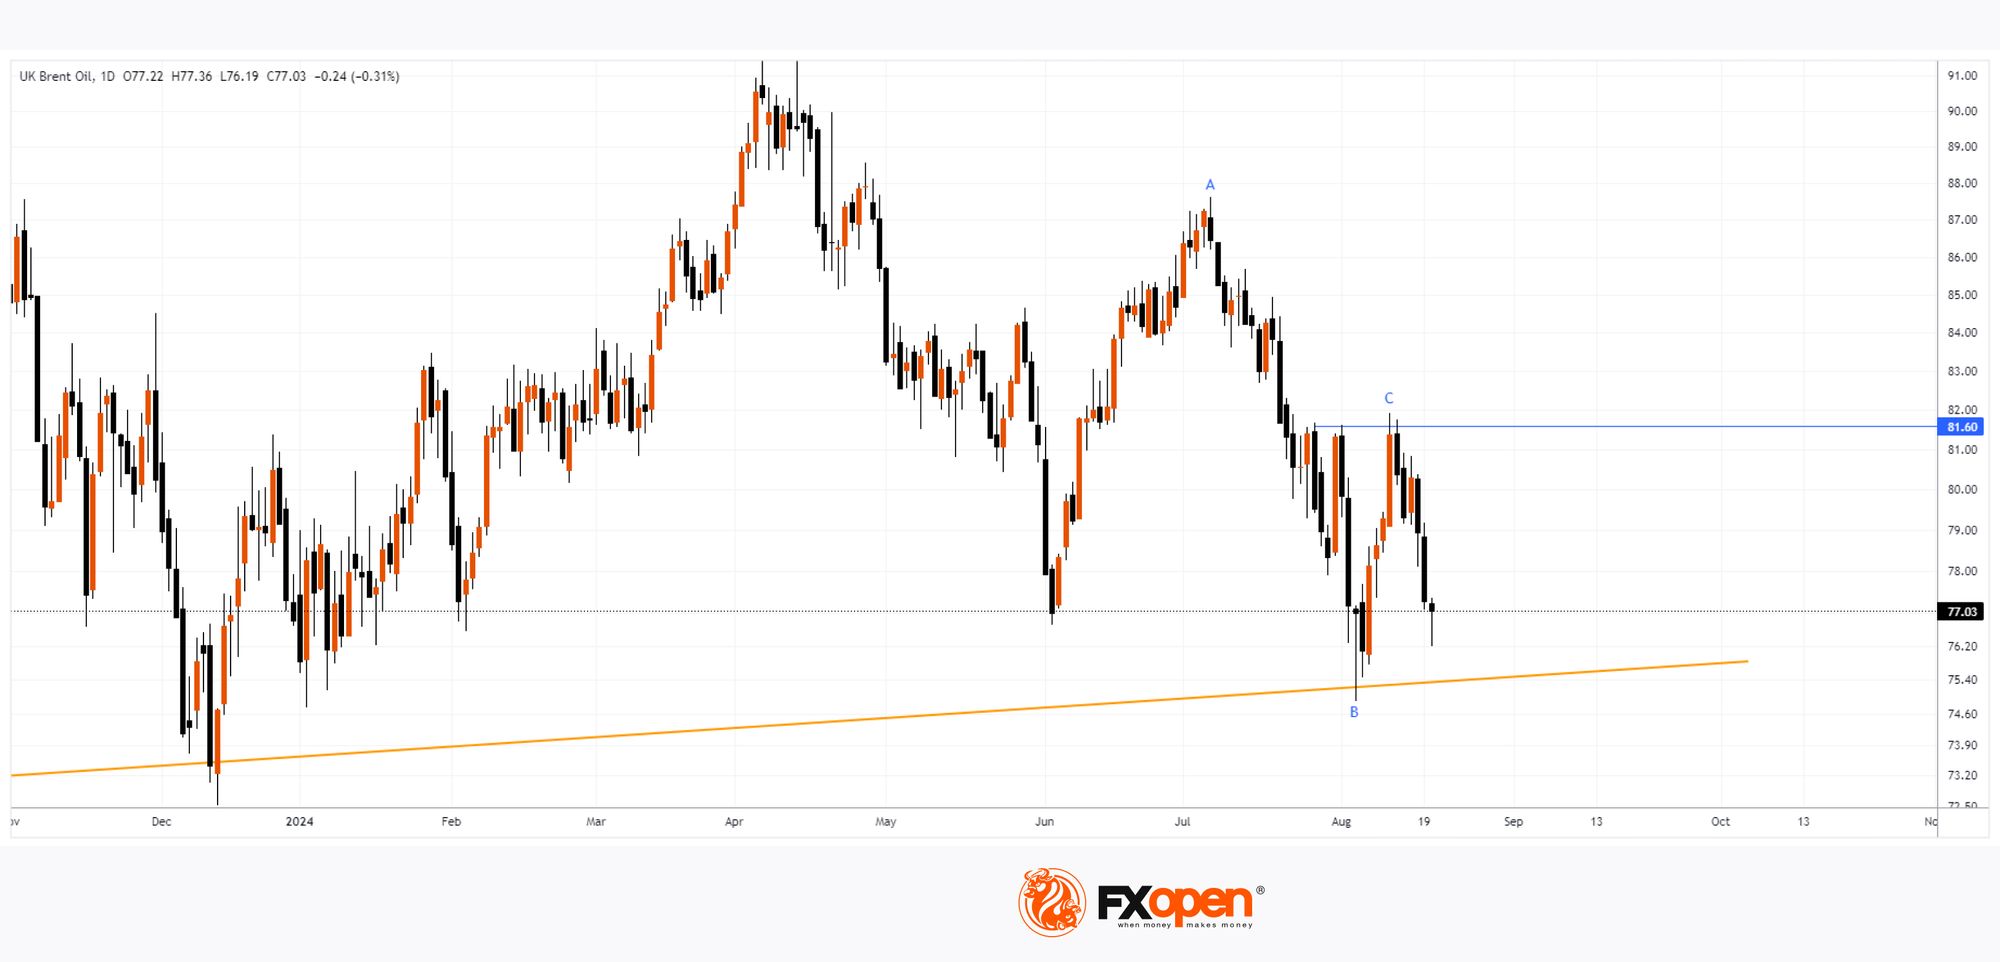
Technical analysis of the XBR/USD chart indicates that the price is approaching a key support level (shown in yellow) that dates back to 2023. This raises concerns, especially given the bearish indicators:
→ The recovery from B to C has retraced approximately 50% of the A to B downward impulse;
→ The formation of peak C has seen false bullish breakouts of previous local highs;
→ The bearish candles on Friday and Monday have broad bodies and closed near their lows, indicating a lack of demand (or effective selling pressure).
Thus, it is reasonable to assume that the bears might attempt to breach the critical support level, potentially leading to a new low for August.
Start trading commodity CFDs with tight spreads (additional fees may apply). Open your trading account now or learn more about trading commodity CFDs with FXOpen.
This article represents the opinion of the Companies operating under the FXOpen brand only. It is not to be construed as an offer, solicitation, or recommendation with respect to products and services provided by the Companies operating under the FXOpen brand, nor is it to be considered financial advice.
Stay ahead of the market!
Subscribe now to our mailing list and receive the latest market news and insights delivered directly to your inbox.


Latest articles

Market Analysis: GBP/USD Dips Further As EUR/GBP Regains Traction
GBP/USD failed to climb above 1.3500 and corrected some gains. EUR/GBP started a decent increase and might aim for more gains above 0.8700.
Important Takeaways for GBP/USD and EUR/GBP Analysis Today
· The British Pound


Market Insights with Gary Thomson: Oil, US Retail Sales & NFP in Focus
In this video, we’ll explore the key economic events and market trends, shaping the financial landscape. Get ready for insights into financial markets to help you navigate the week ahead. Let’s dive in!
In this episode of Market