


FXOpen
As shown by the chart, yesterday, shares of Broadcom Inc. (AVGO)—a US technology company ranked in the top 10 by market capitalisation—were among the worst performers in terms of price movement.
This is a warning sign for those investing in semiconductor manufacturers, considering that:
→ Tomorrow, data on Nvidia’s second-quarter performance will be released;
→ Since mid-June, AVGO's share price has been underperforming the stock index.
A technical analysis of the AVGO chart provides further grounds for concern:
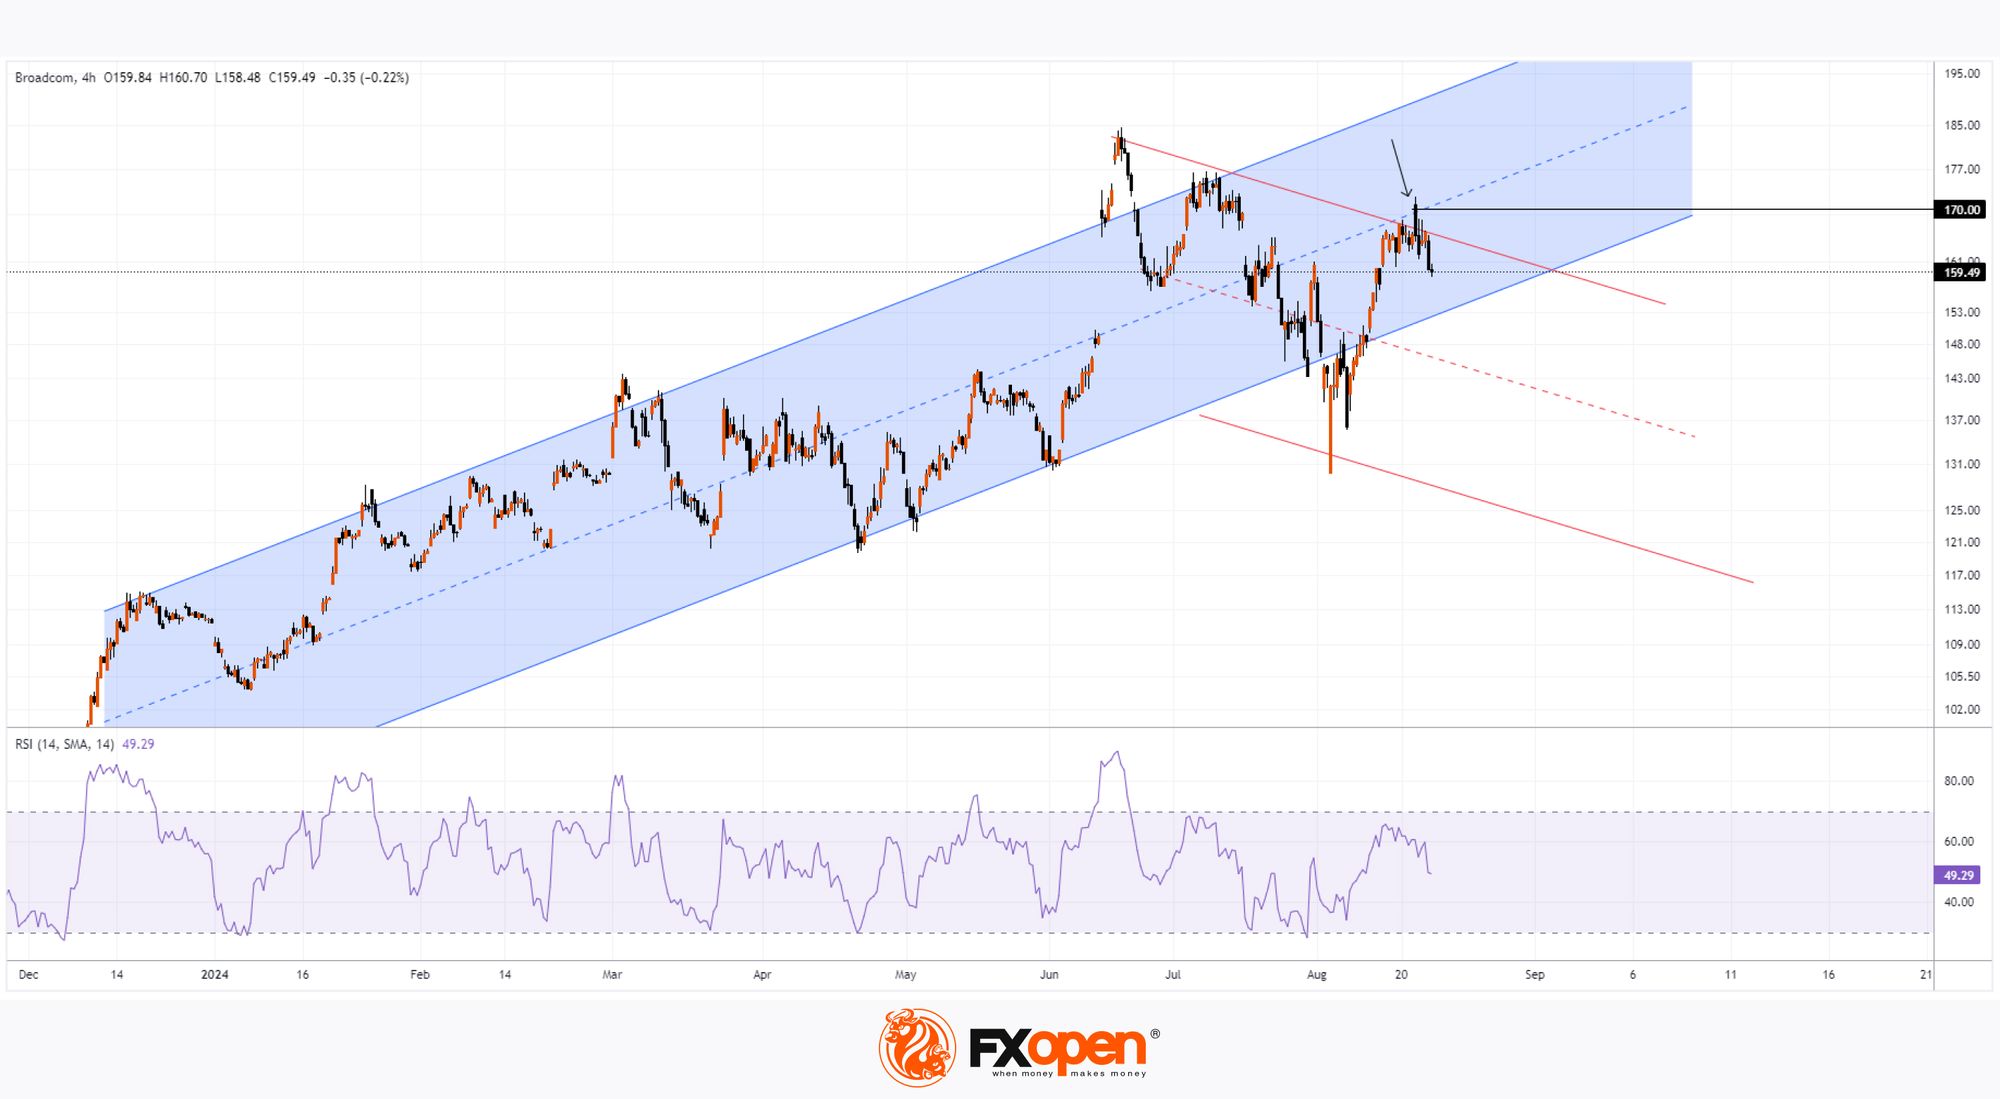
→ In 2024, the price formed an ascending channel (shown in blue), which remains relevant for now, despite a drop below the lower boundary on 5 August.
→ Price action in August indicates (marked by an arrow) that the median line of this channel, reinforced by the psychological level at $170, has now assumed the role of resistance.
→ In mid-July, there was a 10-for-1 stock split. It was expected that this would make investments in Broadcom Inc. more accessible to a wider range of market participants, but in reality, the price has fallen since then.
→ Since mid-June, when the RSI indicated extreme overbought conditions following the release of first-quarter results (a sign of market hype), the price has been increasingly forming the outlines of a descending channel (shown in red).
If AVGO's share price continues to underperform the market, it could lead to further bearish attacks on the lower boundary of the ascending channel.
Meanwhile, analysts remain optimistic. According to TipRanks:
→ 23 out of 24 Wall Street analysts recommend buying AVGO shares;
→ The average price target for AVGO shares is $196 (a 23% increase from current levels) within the next 12 months.
Buy and sell stocks of the world's biggest publicly-listed companies with CFDs on FXOpen’s trading platform. Open your FXOpen account now or learn more about trading share CFDs with FXOpen.
This article represents the opinion of the Companies operating under the FXOpen brand only. It is not to be construed as an offer, solicitation, or recommendation with respect to products and services provided by the Companies operating under the FXOpen brand, nor is it to be considered financial advice.
Stay ahead of the market!
Subscribe now to our mailing list and receive the latest market news and insights delivered directly to your inbox.


Latest articles

European Currencies Decline: Pound Hits New Lows, Euro Under Pressure
European currencies continue to weaken against the US dollar amid rising geopolitical tensions and increased demand for safe-haven and liquid assets. Market participants are reducing exposure to riskier instruments, putting pressure on both the euro and the pound. Additional support

Market Analysis: GBP/USD Dips Further As EUR/GBP Regains Traction
GBP/USD failed to climb above 1.3500 and corrected some gains. EUR/GBP started a decent increase and might aim for more gains above 0.8700.
Important Takeaways for GBP/USD and EUR/GBP Analysis Today
· The British Pound
