


FXOpen
The chart shows that at the end of last week, Broadcom Inc. (AVGO) stock price surged nearly 20%, breaking the psychological barrier of $200 per share and pushing the company’s market capitalisation to $1 trillion.
Last week, the company released its quarterly earnings report. The actual figures were close to analysts' forecasts — earnings per share of $1.42 vs $1.39 expected and fourth-quarter revenue of $14.05 billion vs $14.07 billion expected. However, the extraordinary rise in stock price was driven by a strong market reaction to the company's optimistic forecast, which is based on robust sales of chips designed for artificial intelligence (AI) applications.
Media reports highlight that the company’s revenue growth from the AI boom reached 220% year-over-year, and the total AI chip market could reach approximately $90 billion by 2027.
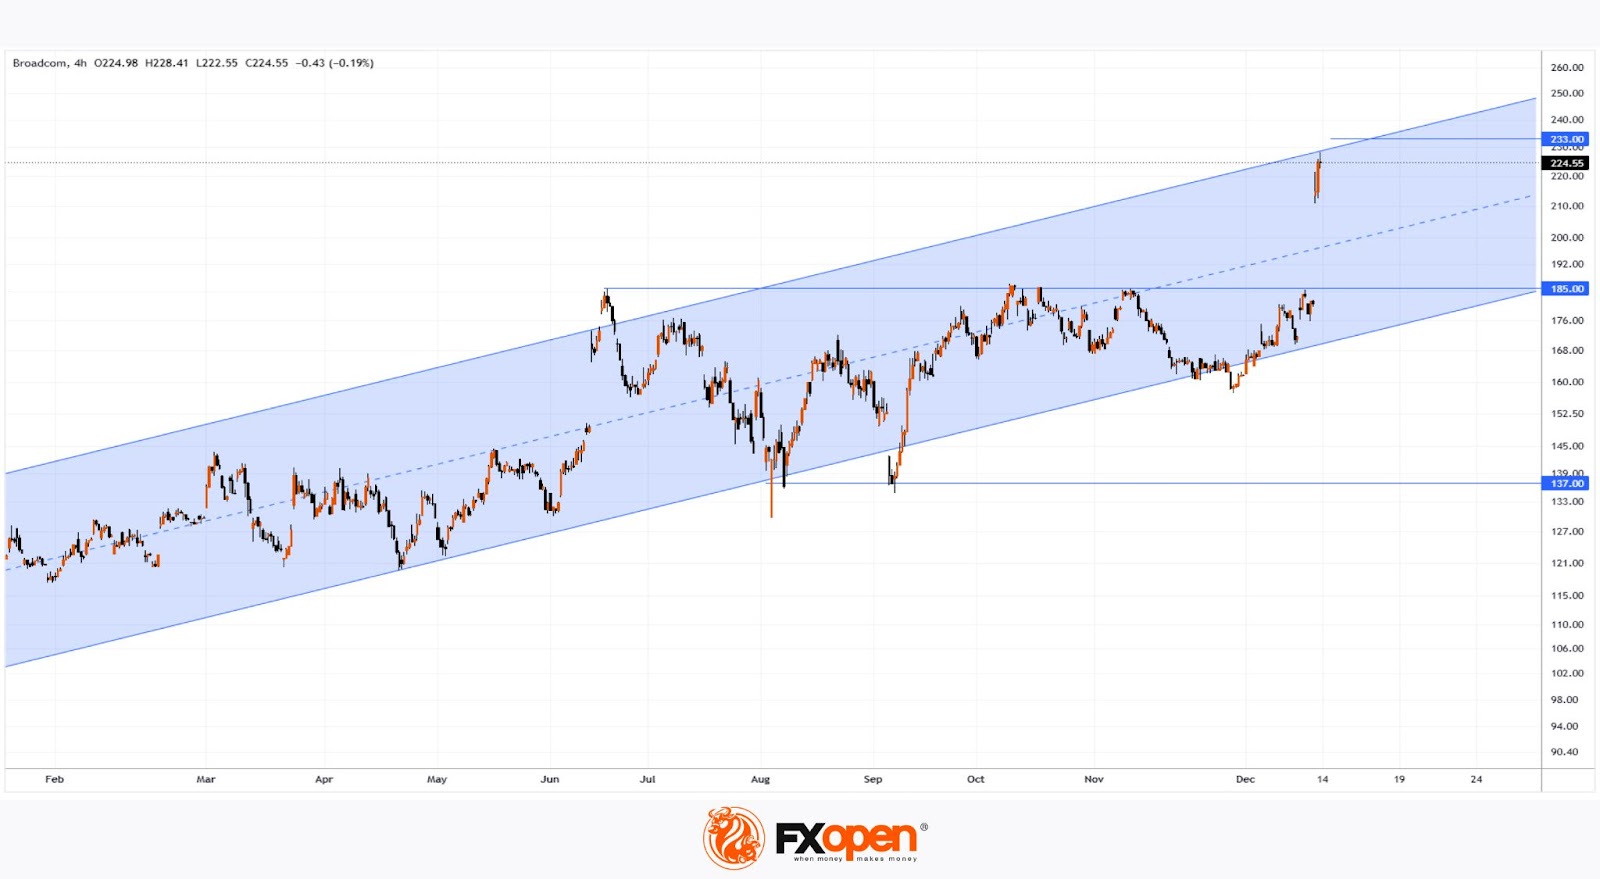
Technical analysis of the AVGO chart indicates the formation of a significant bullish gap:
→ In 2024, the price formed an ascending channel (shown in blue). Now it is near its upper boundary.
→ By measuring the width of the range between $139 and $185 to set a target for price movement following its bullish breakout, the level of $233 is obtained.
If the bullish momentum continues, the AVGO stock price could rise above the upper boundary of the ascending channel (as it did in mid-June), potentially reaching the specified target. Following this sharp increase, the price might correct, possibly moving toward the area of the bullish gap.
According to TipRanks, the average price target for AVGO shares is $229. However, given the information on anticipated future earnings released last Friday, these forecasts may be revised upwards.
Buy and sell stocks of the world's biggest publicly-listed companies with CFDs on FXOpen’s trading platform. Open your FXOpen account now or learn more about trading share CFDs with FXOpen.
This article represents the opinion of the Companies operating under the FXOpen brand only. It is not to be construed as an offer, solicitation, or recommendation with respect to products and services provided by the Companies operating under the FXOpen brand, nor is it to be considered financial advice.
Stay ahead of the market!
Subscribe now to our mailing list and receive the latest market news and insights delivered directly to your inbox.


Latest articles

Market Analysis: GBP/USD Dips Further As EUR/GBP Regains Traction
GBP/USD failed to climb above 1.3500 and corrected some gains. EUR/GBP started a decent increase and might aim for more gains above 0.8700.
Important Takeaways for GBP/USD and EUR/GBP Analysis Today
· The British Pound


Market Insights with Gary Thomson: Oil, US Retail Sales & NFP in Focus
In this video, we’ll explore the key economic events and market trends, shaping the financial landscape. Get ready for insights into financial markets to help you navigate the week ahead. Let’s dive in!
In this episode of Market