


BTC/USD Analysis: Bitcoin Price at a Crossroads
FXOpen

In our analysis of the long-term BTC/USD chart on the morning of 29 July, we noted that:
→ Bitcoin's price rise was occurring within an ascending channel (shown in blue);
→ Simultaneously, the price movement was forming the contours of a smaller-scale descending channel, indicated in red;
→ The positive sentiment in the cryptocurrency market at the end of July may have been sparked by Trump's statements at the Bitcoin 2024 conference in Nashville. However, these appeared more like campaign rhetoric;
→ The psychological level of $70k could have had a significant impact on the price.
Since then, Bitcoin’s price:
→ Experienced a false bullish breakout above the $70k psychological level;
→ Dropped by over 27%, followed by a false bearish breakout below the $50k psychological level.
This provided a clear example of how price behaviour in volatile cryptocurrency markets is vulnerable to breaching round-number levels, which have a psychological effect on market participants (and on triggering stop-loss orders set beyond them).
What’s next?
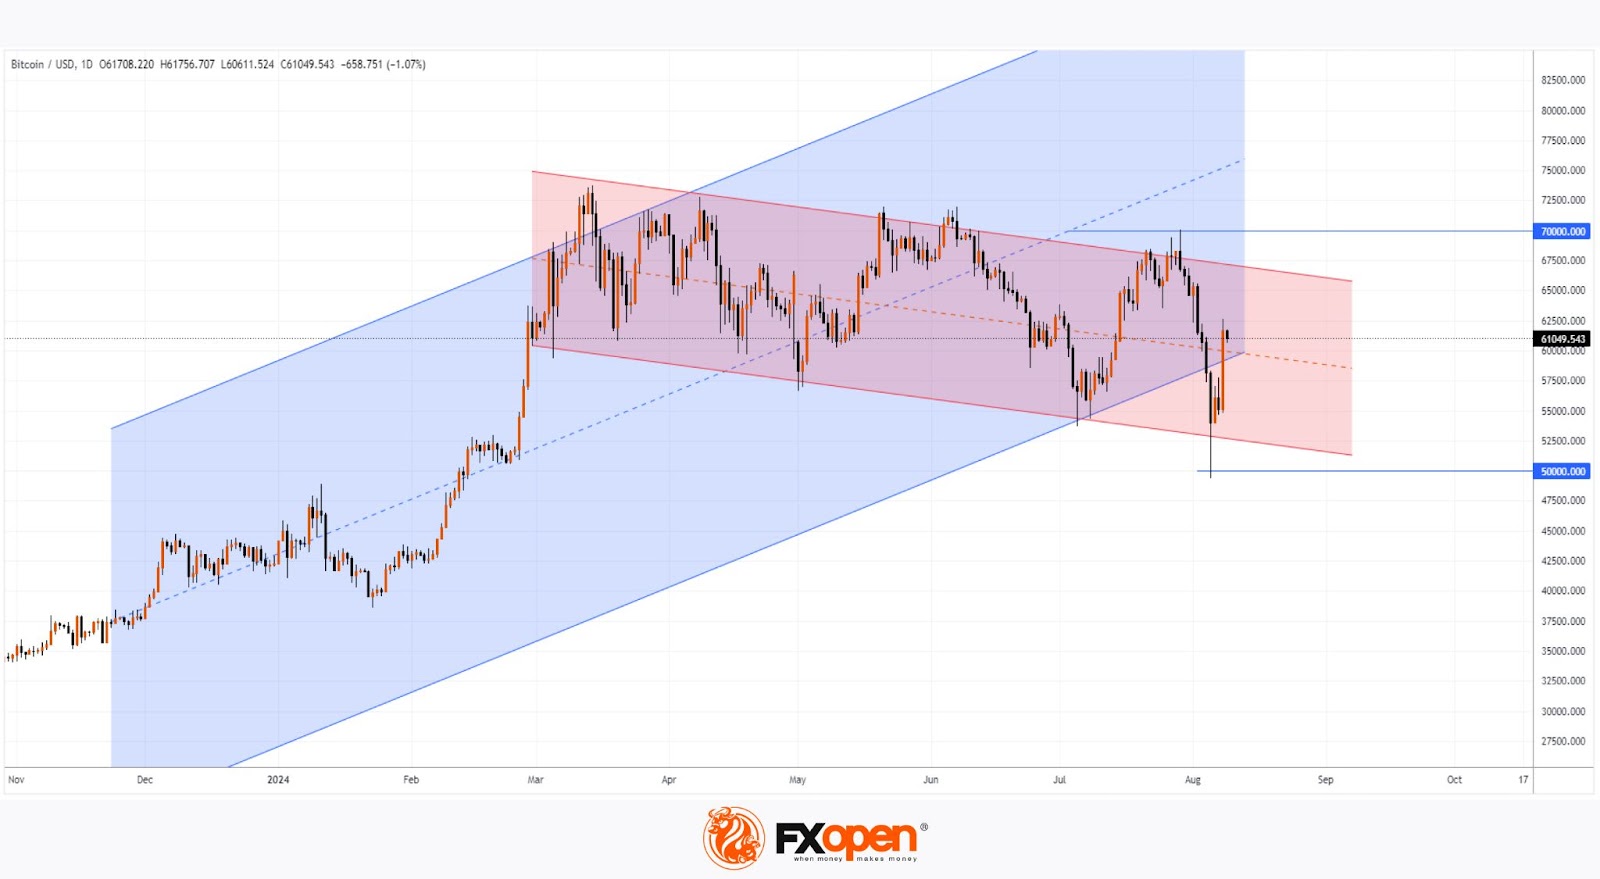
Today's technical analysis of the BTC/USD chart shows that the price has risen above $60k, placing it:
→ Roughly halfway between the $70k resistance and $50k support levels;
→ Within both the blue ascending and red descending channels.
Under these conditions, it’s reasonable to expect the market to stabilise, with a consolidation zone forming on the BTC/USD chart. A breakout from this zone could signal the direction of the next significant trend movement.
FXOpen offers the world's most popular cryptocurrency CFDs*, including Bitcoin and Ethereum. Floating spreads, 1:2 leverage — at your service (additional fees may apply). Open your trading account now or learn more about crypto CFD trading with FXOpen.
*Important: At FXOpen UK, Cryptocurrency trading via CFDs is only available to our Professional clients. They are not available for trading by Retail clients. To find out more information about how this may affect you, please get in touch with our team.
This article represents the opinion of the Companies operating under the FXOpen brand only. It is not to be construed as an offer, solicitation, or recommendation with respect to products and services provided by the Companies operating under the FXOpen brand, nor is it to be considered financial advice.
Stay ahead of the market!
Subscribe now to our mailing list and receive the latest market news and insights delivered directly to your inbox.


Latest articles

CAD/JPY: The Yen's Most Historic Move in 30 Years Meets a Fragile Support
Two central banks are heading in genuinely opposite directions this week, and the tension is unmistakable. The Bank of Canada held rates steady at 2.25% on September 2, with a mildly hawkish tilt as policymakers acknowledged a broadening economic

USD/JPY and USD/CAD Await Key Fed Decision
The US dollar is consolidating against the yen and Canadian dollar ahead of the key event of the week — the Federal Reserve meeting. The Fed is widely expected to raise its policy rate by 25 basis points to a range

UnitedHealth: Fundamentals Are Healing, Now the Chart Must Agree
UnitedHealth finds itself in a genuinely split narrative right now, trading near $388, down about 15.9% from its 52-week high, even as the fundamental picture keeps improving. Q2 earnings beat expectations, with revenue of $112.03 billion, and the