


FXOpen

Analysing the long-term BTC/USD chart on 16th May, we created a "roadmap" for Bitcoin's price, which looked like an expanding fan and consisted of a median line with support levels below it and resistance levels above it.
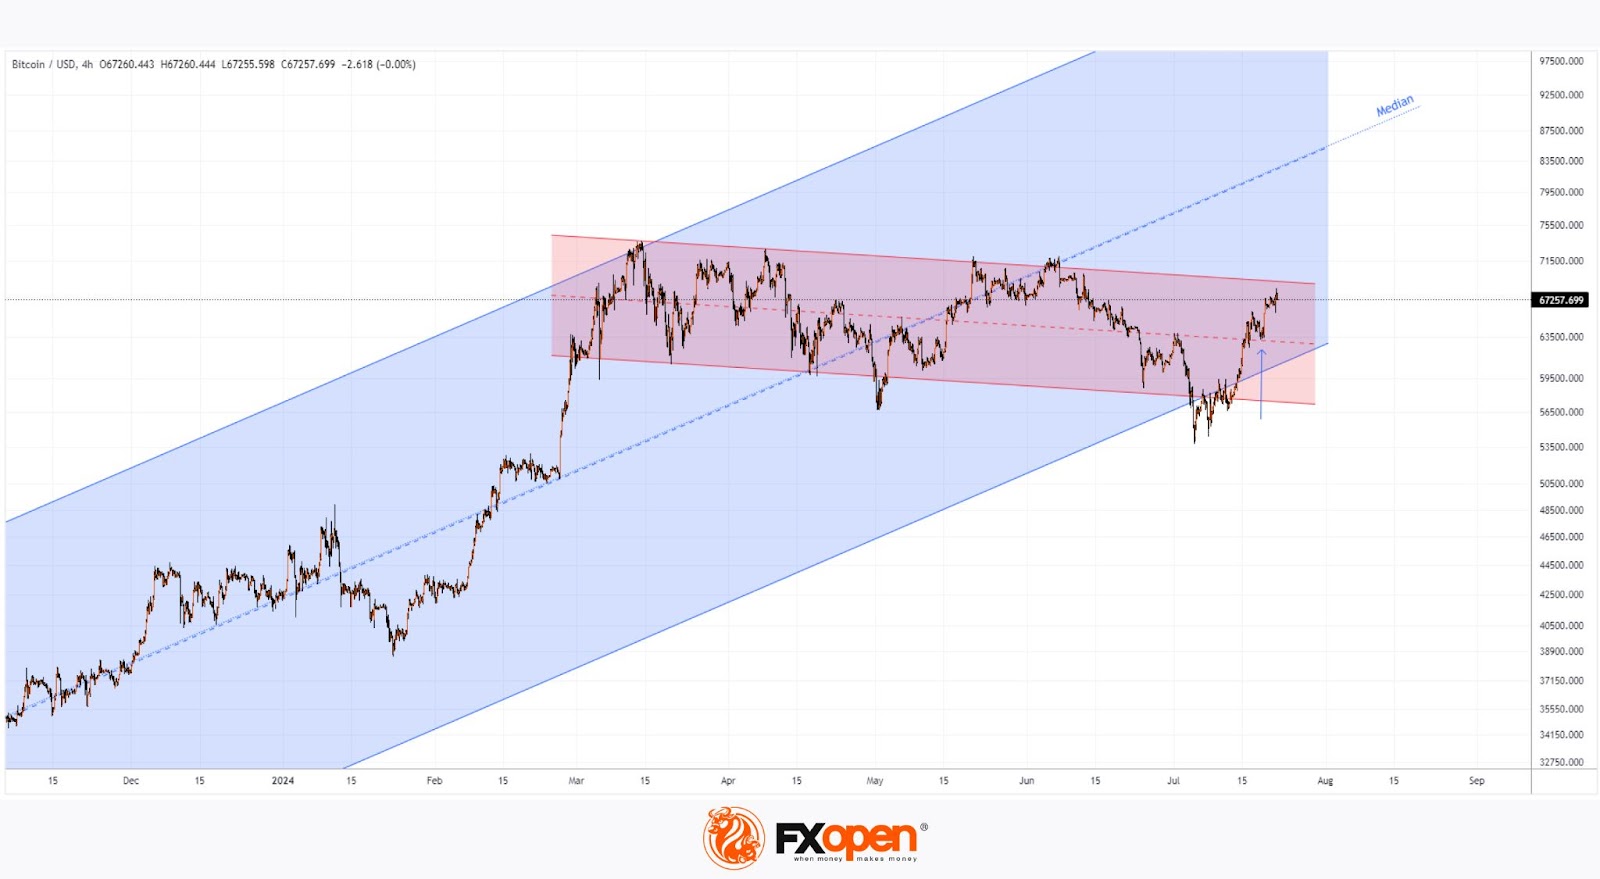
Today, when analysing the BTC/USD chart, we will remove the fan lines to shift the focus to Bitcoin's price action within the context of two trend channels:
→ Blue ascending channel. Its median coincides with the median of the previously mentioned fan.
→ Red descending channel. This appears to be a correction within the larger ascending channel.
Bitcoin's price today is approaching the resistance formed by the upper boundary of the red channel. The price action relative to this resistance will provide crucial information – has the leading cryptocurrency indeed been going through a correction phase?
An optimistic scenario is not out of the question – there could be a bullish breakout of the upper boundary of the red channel by the end of July, paving the way to the median of the blue channel, along which the price has been rising since last autumn.
From a technical analysis perspective, supporting this scenario is the fact that the median of the red channel has switched roles from resistance to support (indicated by an arrow).
From a fundamental perspective, market participants' optimism is bolstered by the approval of the Ethereum ETF and the upcoming Bitcoin 2024 conference in Nashville, scheduled for 25-27 July. It is expected that Donald Trump and Elon Musk will speak at the event, potentially making significant announcements.
FXOpen offers the world's most popular cryptocurrency CFDs*, including Bitcoin and Ethereum. Floating spreads, 1:2 leverage — at your service (additional fees may apply). Open your trading account now or learn more about crypto CFD trading with FXOpen.
*Important: At FXOpen UK, Cryptocurrency trading via CFDs is only available to our Professional clients. They are not available for trading by Retail clients. To find out more information about how this may affect you, please get in touch with our team.
This article represents the opinion of the Companies operating under the FXOpen brand only. It is not to be construed as an offer, solicitation, or recommendation with respect to products and services provided by the Companies operating under the FXOpen brand, nor is it to be considered financial advice.
Stay ahead of the market!
Subscribe now to our mailing list and receive the latest market news and insights delivered directly to your inbox.


Latest articles

NVDA Shares Approach Key Resistance
Nvidia’s chip production is concentrated with Taiwanese contractor TSMC, increasing the company’s exposure to geopolitical risks and US export policy. Restrictions on shipments to China, including decisions related to H20-series chips, have led to significant financial adjustments, which

EUR/USD and GBP/USD at Range Boundaries Ahead of Geopolitical Decisions
European currencies are entering a consolidation phase following an attempted recovery, while market participants adopt a wait-and-see approach amid uncertainty surrounding the geopolitical landscape. Current price action reflects a balance between a softer US dollar and a lack of sustained

Market Analysis: Gold Price Slips Back, WTI Crude Oil Rally Gains Fresh Strength
Gold price rallied above $4,750 before correcting lower. Crude oil prices are rising and could climb further higher toward $110.00.
Important Takeaways for Gold and WTI Crude Oil Prices Analysis Today
· Gold price gained pace for a move