


Bitcoin Price Hits a Month's High, Breaking Key Resistance
FXOpen

Yesterday's release of CPI figures suggests that inflation is slowing down and a rate cut could be on the horizon. This weakened the dollar and boosted the value of assets priced in dollars, including BTC/USD.
As a result, the price of Bitcoin hit a May high.
Meanwhile, there is sustained demand in the market driven by institutional participants investing in Bitcoin ETFs. According to media reports citing 13F filings:
→ JP Morgan invested $731,246 USD
→ Wells Fargo invested $141,817 USD in Grayscale's GBTC.
→ Similar activity is observed with other traditional banks like BNP Paribas and BNY Mellon, indicating a broader industry trend.
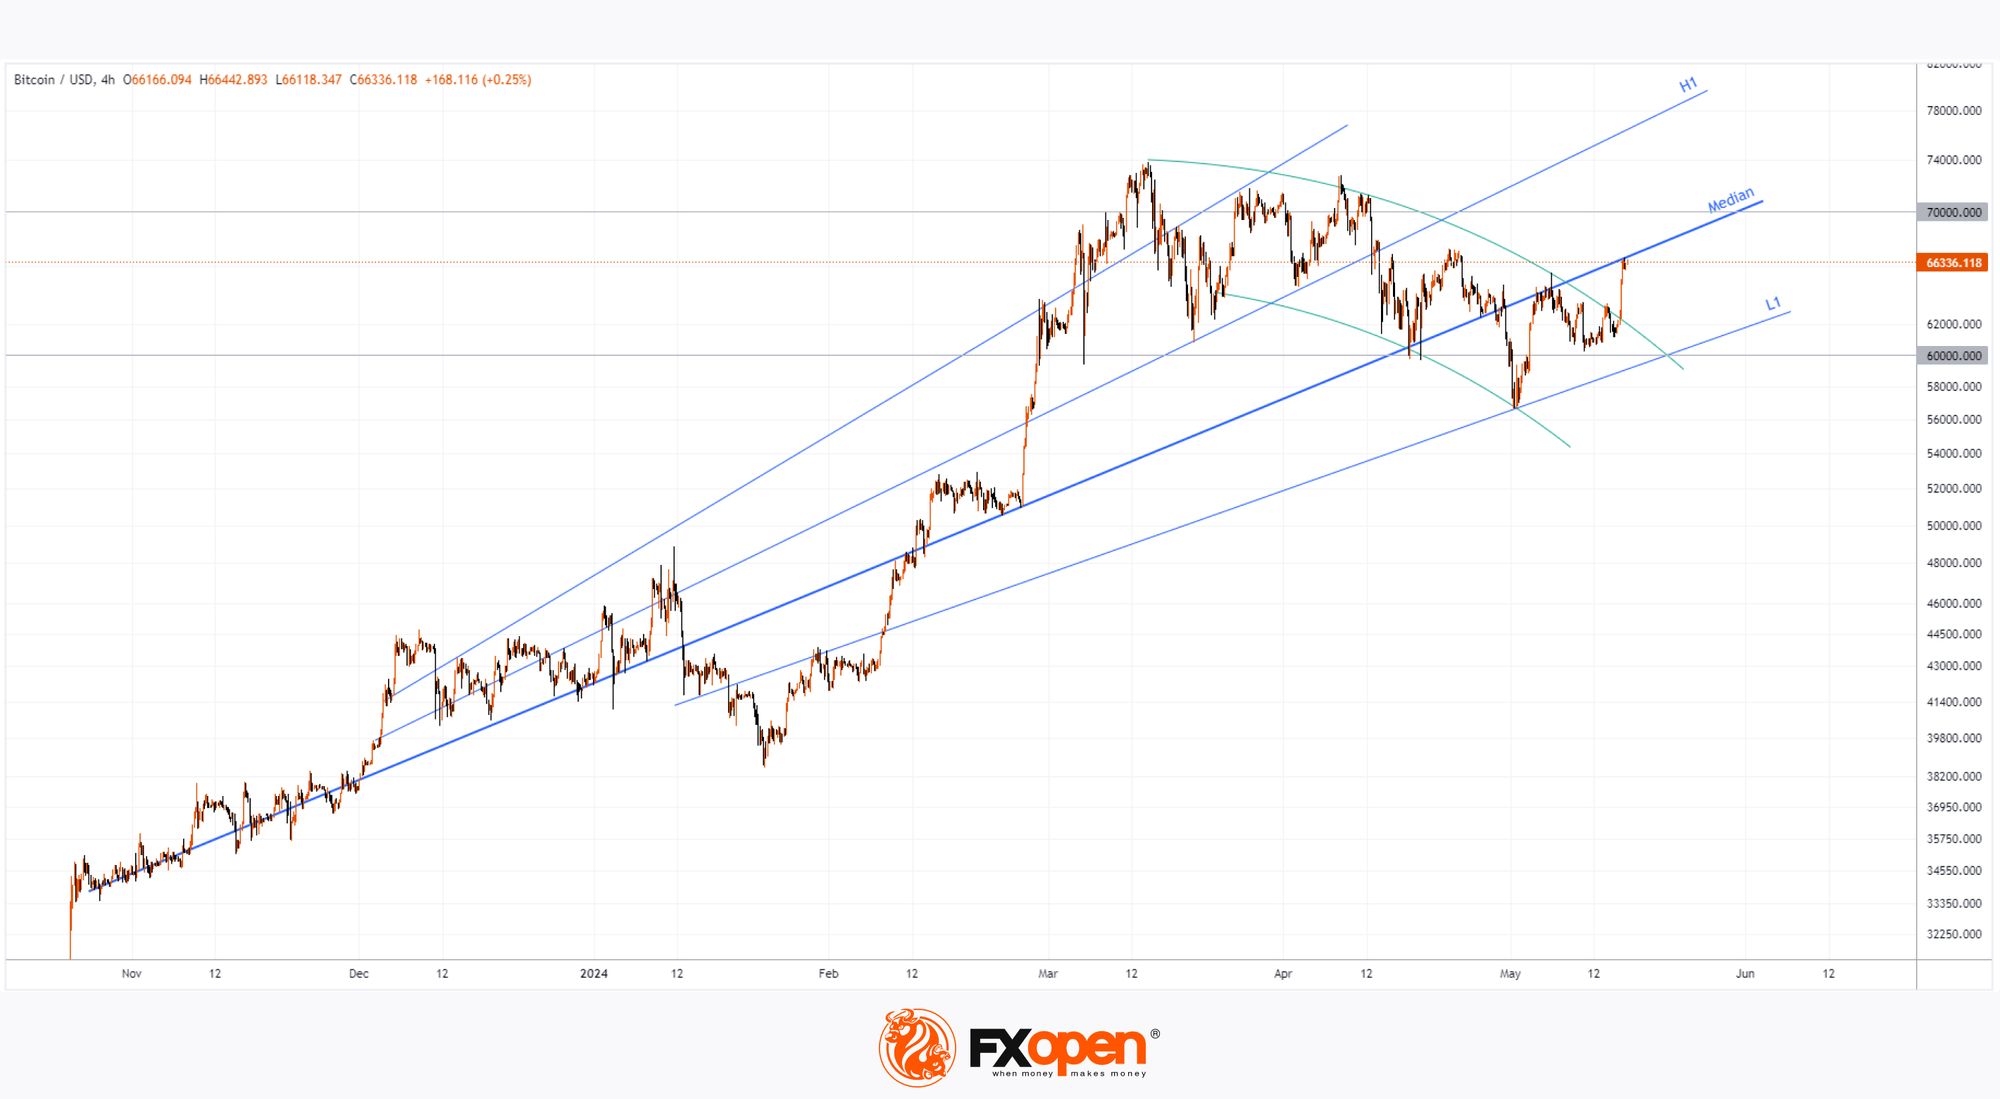
Technical analysis of the BTC/USD chart shows that since last November, the Bitcoin price has been forming an expanding fan (shown in blue lines) - similar to what Jesse Livermore referred to as an Accumulation Cylinder (bullish sign).
In addition:
→ The Bitcoin price broke above a two-curve formation (shown in green), which can be interpreted as a 2-month correction from the historical peak on March 14 within the upward trend described by the blue lines;
→ The Bitcoin price reached the fan's median line (shown as a thickened line).
Being around the median can be seen as a precursor to forming a short-term flat and BTC/USD price fluctuations with low intensity around the median.
However, if institutional investments do not weaken and the prospect of rate cuts becomes more real, bulls may attempt to push the Bitcoin price towards the H1 line, signalling a path towards a new historical peak around $100k per coin.
FXOpen offers the world's most popular cryptocurrency CFDs*, including Bitcoin and Ethereum. Floating spreads, 1:2 leverage — at your service (additional fees may apply). Open your trading account now or learn more about crypto CFD trading with FXOpen.
*Important: At FXOpen UK, Cryptocurrency trading via CFDs is only available to our Professional clients. They are not available for trading by Retail clients. To find out more information about how this may affect you, please get in touch with our team.
This article represents the opinion of the Companies operating under the FXOpen brand only. It is not to be construed as an offer, solicitation, or recommendation with respect to products and services provided by the Companies operating under the FXOpen brand, nor is it to be considered financial advice.
Stay ahead of the market!
Subscribe now to our mailing list and receive the latest market news and insights delivered directly to your inbox.


Latest articles

AI Valuations Are Back in the Spotlight
Artificial intelligence remains the dominant investment theme of 2026, but investors are increasingly questioning whether AI stock valuations are keeping pace with reality.
💰 Big Tech continues to invest at an unprecedented scale, with hyperscaler AI spending projected to exceed $800

AUD/CAD: Months of Indecision — Is a Breakout Finally Coming?
The Australian dollar has clawed back most of its end-of-June losses, when it touched three-month lows against the greenback amid escalating Middle East tensions. Since then, sentiment has improved: the RBA's Assistant Governor Sarah Hunter signalled the board stands ready

USD/JPY: Battling at the Top of the Triangle
On 3 July, Japan's Finance Minister, Satsuki Katayama, stated that the Ministry of Finance remains in close contact with US authorities regarding developments in USD/JPY as the yen traded near its weakest level in almost 40 years. Similar verbal