


BTC/USD Analysis: Test of an Important Breakout Amid Scary News
FXOpen

The cryptocurrency market is shaken by claims from the SEC. The lawsuits by the US financial regulator against the world's largest cryptocurrency exchange Binance and its head Changpeng Zhao have added to the lawsuits against the Coinbase exchange, whose shares are traded on Nasdaq. In response, Coinbase representatives said that the exchange has no plans to ban the trading of crypto assets that the SEC considers securities, and does not plan to phase out staking services.
Cryptocurrency market participants anxiously monitor incoming news:
→ Hearings are scheduled for June 14 on the SEC request to freeze Binance.US assets.
→ A division of Binance.US has drastically reduced the number of cryptocurrency pairs available for trading.
→ Coinbase does not see the risk of losing customers or banking partners; the exchange has more than $5 billion on its balance sheet, available to maintain operations and pay legal fees.
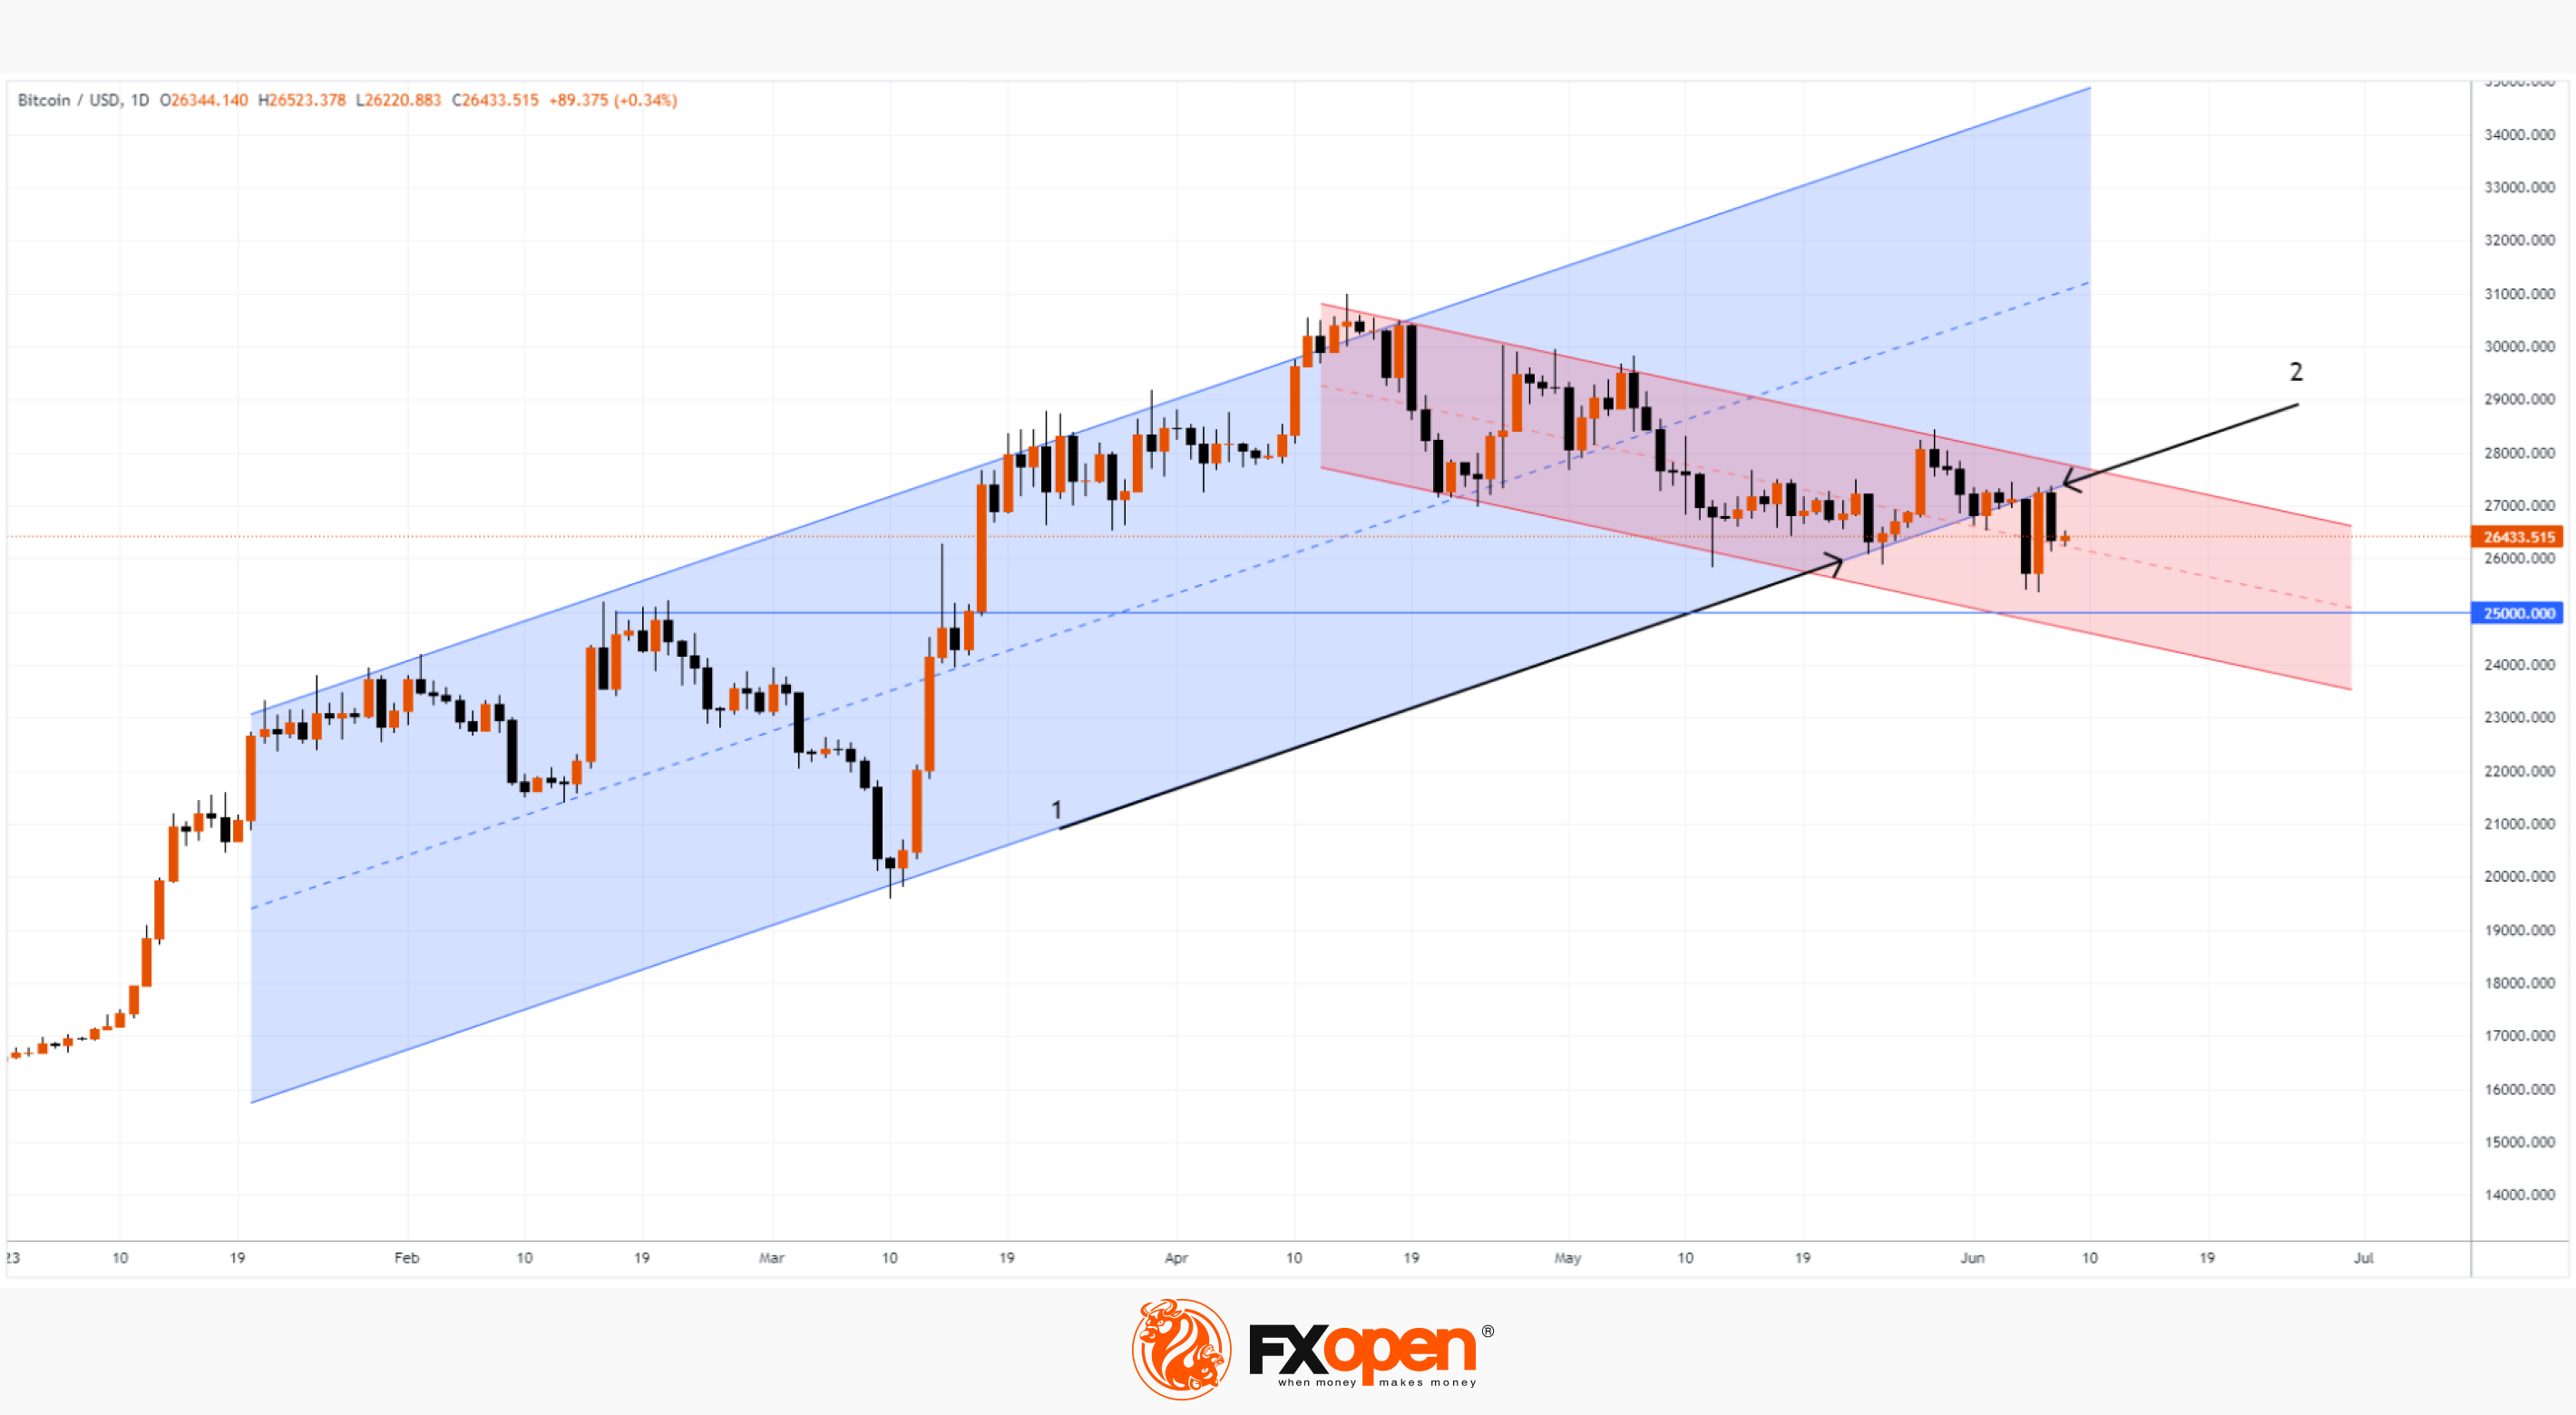
Meanwhile, an important breakout test took place on the BTC/USD chart. The price of BTC/USD bounced several times (in late May and early June) from the lower border of the trend channel (1), which has been in effect since the beginning of 2023. But after the news about the lawsuits from the SEC against Binance, it had a bearish breakdown, and yesterday its test was formed on the chart – the price of BTC/USD turned down from the breakdown zone above USD 27k. The bearish breakout test suggests that the price of BTC/USD may continue to decline — consider a scenario in which it, moving within the red descending channel in the face of negative news, can reach an important psychological level of USD 27k.
This article represents the opinion of the Companies operating under the FXOpen brand only. It is not to be construed as an offer, solicitation, or recommendation with respect to products and services provided by the Companies operating under the FXOpen brand, nor is it to be considered financial advice.
Stay ahead of the market!
Subscribe now to our mailing list and receive the latest market news and insights delivered directly to your inbox.

Latest articles

AUD/CAD: Months of Indecision — Is a Breakout Finally Coming?
The Australian dollar has clawed back most of its end-of-June losses, when it touched three-month lows against the greenback amid escalating Middle East tensions. Since then, sentiment has improved: the RBA's Assistant Governor Sarah Hunter signalled the board stands ready

USD/JPY: Battling at the Top of the Triangle
On 3 July, Japan's Finance Minister, Satsuki Katayama, stated that the Ministry of Finance remains in close contact with US authorities regarding developments in USD/JPY as the yen traded near its weakest level in almost 40 years. Similar verbal

Dow Jones (DJIA): Consolidation Beyond the Trend
Federal Reserve Chair Kevin Warsh testified before Congress on 14–15 July, reaffirming the Fed's commitment to bringing inflation back to target while providing no clear guidance on the future path of interest rates. Meanwhile, June inflation data came in