


BTC/USD Chart Analysis: Will October Be Bullish?
FXOpen

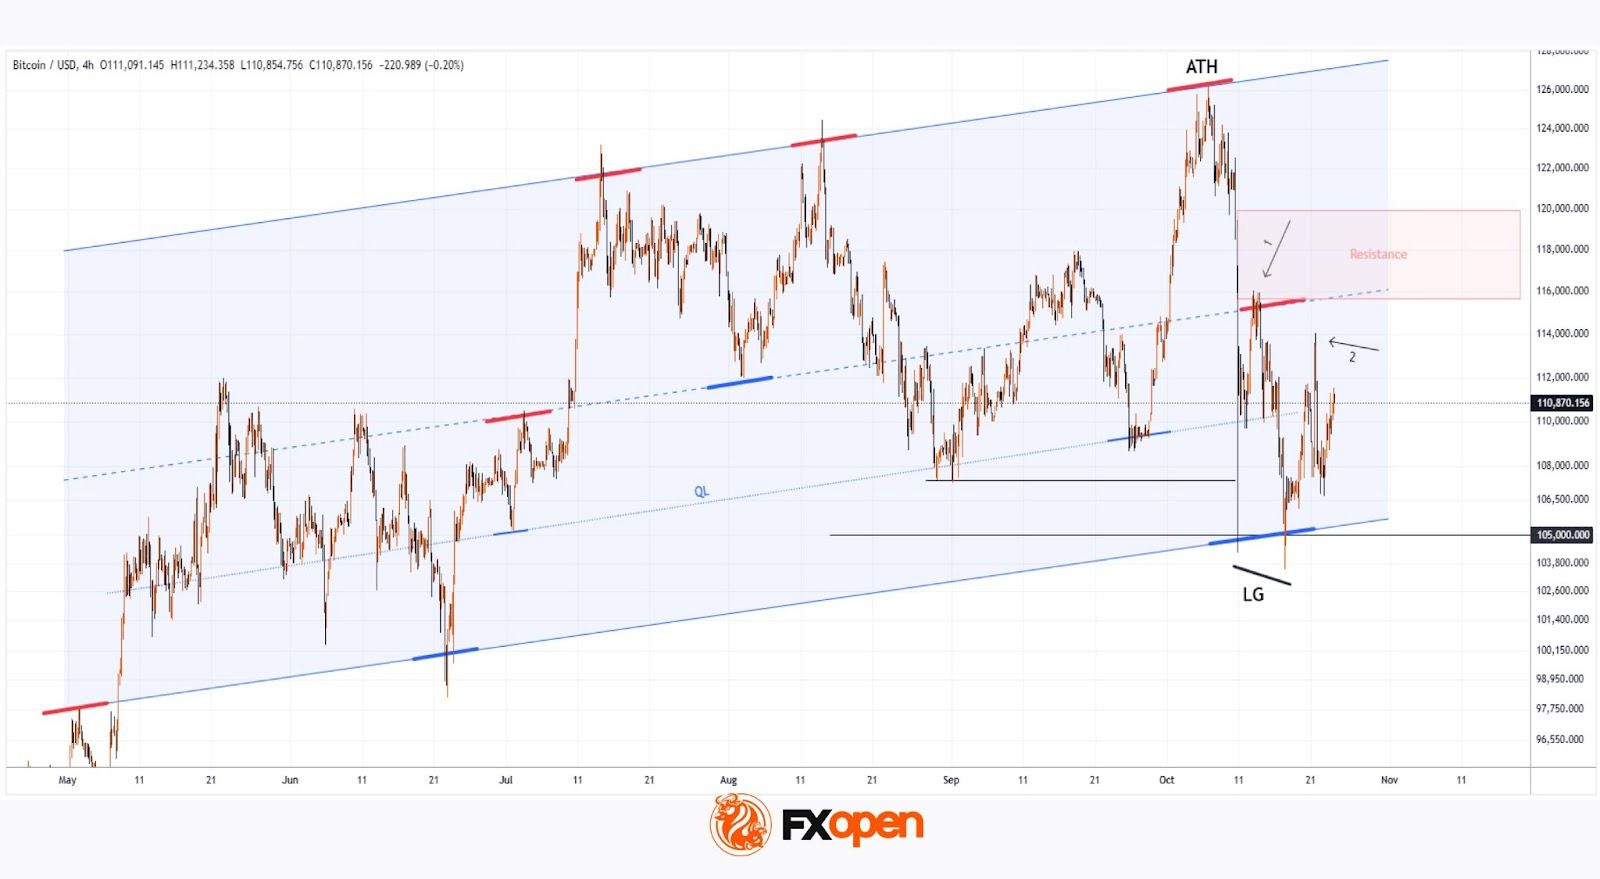
At the start of the month, the BTC/USD rate was hovering around $115k. Historically, October and November have been months when the price of the leading cryptocurrency has shown its strongest gains. A rise towards a new all-time high (ATH) could have continued this “tradition”; however, following Trump’s statement about the potential introduction of 100% tariffs on trade with China, the coin’s price plummeted to $105k. And although the meeting between US and Chinese leaders scheduled for 30 October was expected to ease some concerns, as we can see, Bitcoin’s price has not yet fully recovered from the shocking crash on 10 October. The question of whether the month will turn out to be bullish therefore remains open.
BTC/USD chart analysis shows that price fluctuations since early May have formed an ascending channel, with key reversals marked in red and blue.
Bullish Perspective
Recent news has created a positive fundamental backdrop:
→ Trump has pardoned Binance founder Changpeng Zhao (known as CZ), who in turn suggested that Bitcoin’s market capitalisation could surpass that of gold.
→ Analysts at VanEck believe that the market remains bullish, and that the October decline is merely a correction.
Notably, in October Bitcoin’s price dipped below several key support levels:
→ On 10 October it fell below the September low and the psychological $105k level.
→ On 17 October – below the 10 October low.
The subsequent rebounds confirm that:
→ the lower boundary of the channel remains relevant;
→ buyers were aggressive and successful, as Bitcoin’s price quickly rebounded towards $110k.
From this, it is reasonable to assume that in October, Smart Money used selling flows to build long positions (the 17 October drop resembles a Liquidity Grab pattern).
Bearish Perspective
The wide range between $116k and $120k appears to be a strong resistance zone, as sellers held clear dominance there just two weeks ago.
Arrows on the chart indicate that selling pressure was both aggressive and effective:
1 → pushing the price down from the blue median;
2 → around the $114k level this week.
Conclusion
At present, Bitcoin’s price is near the QL line, which divides the mentioned channel into its two lower quarters – an area where the price may find short-term balance. Today’s US inflation data release will largely determine the next move:
→ upward towards the median (which would improve the chances of a bullish October);
→ downward towards the channel’s lower boundary (which would once again test the bulls’ ability to defend the $105k level).
FXOpen offers the world's most popular cryptocurrency CFDs*, including Bitcoin and Ethereum. Floating spreads, 1:2 leverage — at your service (additional fees may apply). Open your trading account now or learn more about crypto CFD trading with FXOpen.
*Important: At FXOpen UK, Cryptocurrency trading via CFDs is only available to our Professional clients. They are not available for trading by Retail clients. To find out more information about how this may affect you, please get in touch with our team.
This article represents the opinion of the Companies operating under the FXOpen brand only. It is not to be construed as an offer, solicitation, or recommendation with respect to products and services provided by the Companies operating under the FXOpen brand, nor is it to be considered financial advice.
Stay ahead of the market!
Subscribe now to our mailing list and receive the latest market news and insights delivered directly to your inbox.


Latest articles

EUR/USD: All Eyes on the Fed as the Range Reaches Its Breaking Point
The dollar's next move hinges on tonight's Fed decision, and this time markets genuinely don't know what to expect. While economists still lean toward a hold—with CME FedWatch odds sitting near 68.5% for no change—Kevin Warsh's hawkish

USD/JPY and USD/CAD Test Resistance Ahead of Fresh Fed Signals
The US dollar continues to hold the upper hand against most major currencies ahead of the outcome of the latest Federal Reserve meeting. While the base-case scenario remains for interest rates to stay unchanged, markets are also pricing in the

Amazon Earnings: Does the Chart Already Know Something the Numbers Don't?
All eyes are on July 30, when Amazon reports Q2 2026 earnings, with Wall Street increasingly convinced the bar has been set too low. Consensus sees EPS near $1.82-$2.26 on roughly $197 billion in revenue, but the