


Coinbase (COIN) Shares Fall for Fifth Consecutive Day
FXOpen

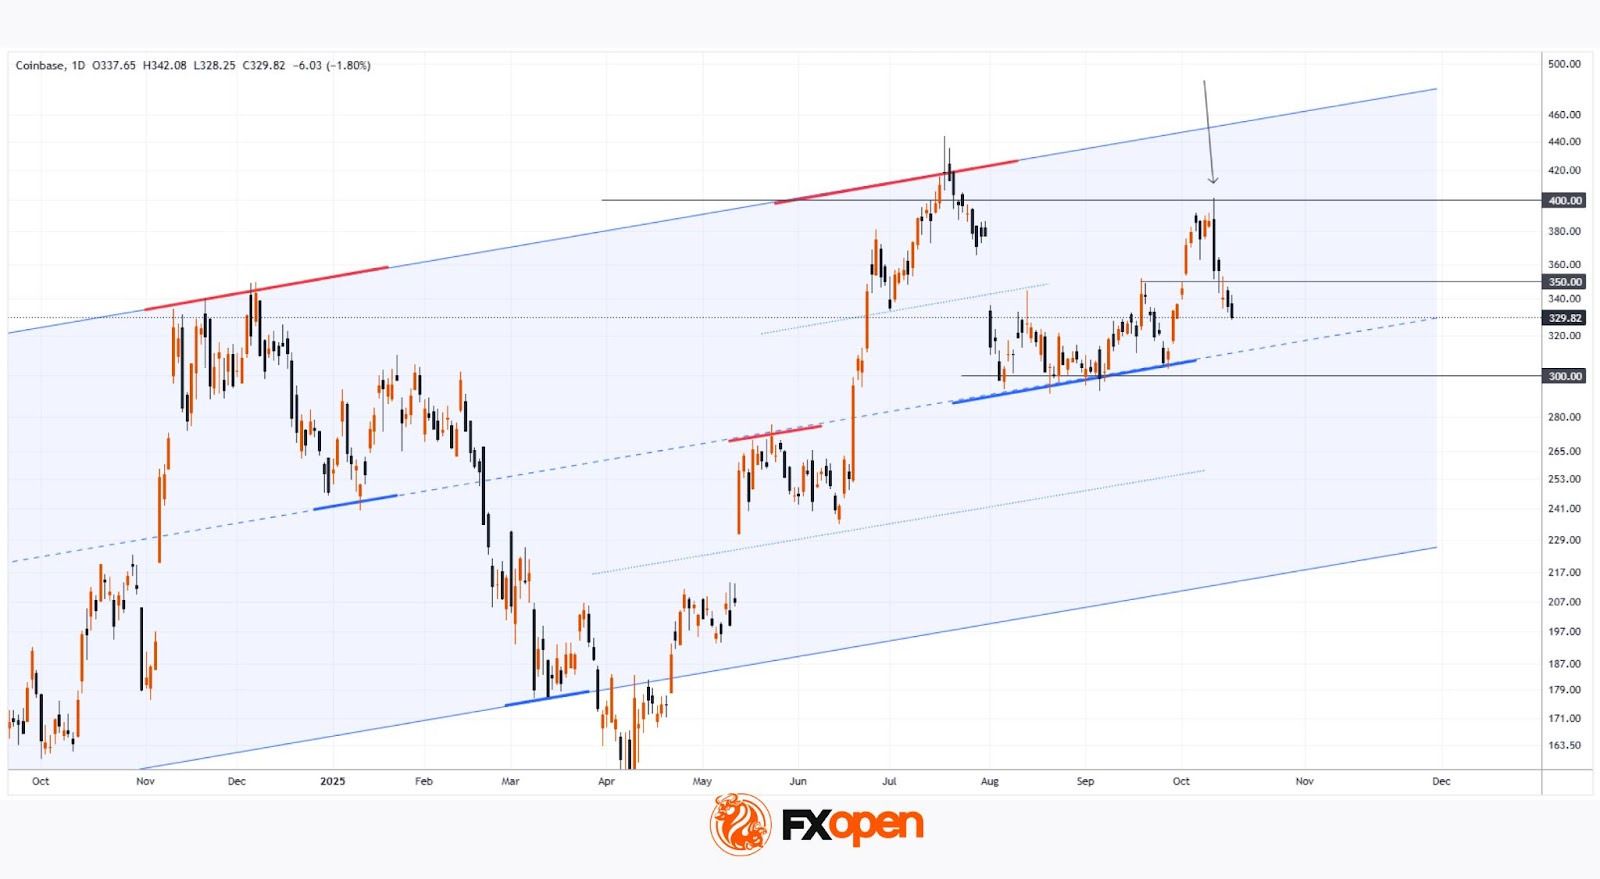
As shown on the Coinbase Global (COIN) chart, the company’s share price has dropped below $330, marking a 17% decline from this month’s high.
Bearish sentiment took hold last Friday after Donald Trump floated the idea of imposing 100% tariffs on Chinese goods:
→ Since then, the cryptocurrency market has struggled to find support.
→ Today, BTC/USD fell below $106,000 for the first time since early July.
COIN shares look set to extend their sequence of five consecutive bearish daily candles, as broader equity markets remain under pressure amid reports of losses at several regional US banks — a situation that some analysts are already comparing to the Silicon Valley Bank collapse in 2023.
The Coinbase (COIN) price chart provides further important insight.
Technical Analysis of the COIN Chart
From a broader perspective, COIN’s price movements have formed a wide upward channel, with:
→ The upper boundary acting as resistance in July;
→ The median line providing support through August and September.
Recent price behaviour around key psychological levels is also worth noting:
→ $400 – the price reversed from just above this round number in October, forming what appears to be a bear trap or liquidity grab pattern.
→ $350 – served as resistance in September and may now regain that role following the sharp reversal from $400.
→ $300 – reinforced the channel’s median as a significant area of support.
Given these factors, it can be assumed that bears remain in control of the market. If this imbalance persists, COIN’s share price may:
→ In the near term, fall back to the median line, and
→ Potentially retest the summer lows around the $290 level.
Buy and sell stocks of the world's biggest publicly-listed companies with CFDs on FXOpen’s trading platform. Open your FXOpen account now or learn more about trading share CFDs with FXOpen.
This article represents the opinion of the Companies operating under the FXOpen brand only. It is not to be construed as an offer, solicitation, or recommendation with respect to products and services provided by the Companies operating under the FXOpen brand, nor is it to be considered financial advice.
Stay ahead of the market!
Subscribe now to our mailing list and receive the latest market news and insights delivered directly to your inbox.


Latest articles

Weekly Market Insights with Gary Thomson: The Week of Central Banks and Earnings
In this video, we’ll explore the key economic events and market trends, shaping the financial landscape. Get ready for insights into financial markets to help you navigate the week ahead. Let’s dive in!
In this episode of Market

Intel at a Crossroads: Earnings Beat Meets Technical Resistance
Intel has just delivered its strongest quarter in over fifteen years, and the market reaction says it all. Q2 2026 revenue surged 25% year-over-year to $16.1 billion, crushing the consensus estimate of $14.42 billion, while adjusted EPS of

Tesla: Complex Range Structure Breaks Down Following Quarterly Earnings
Tesla released its Q2 2026 results after the market closed on 22 July. Revenue increased 26% year-on-year to $28.24 billion, while vehicle deliveries reached a record 480,126 units. However, operating margin fell sharply to 1.4%, down from