


Coinbase (COIN) Shares Reach All-Time High
FXOpen

According to the chart of Coinbase Global (COIN), the share price of the cryptocurrency exchange has reached a historical all-time high (closing price).
The bullish sentiment has been supported by the following factors:
→ Bitcoin price rally. Yesterday, we analysed the BTC/USD chart and anticipated that bulls might attempt to set a new record. Following the publication, Bitcoin made a strong upward move, breaking above the $118,000 level.
→ Passage of the GENIUS bill in the US, which establishes a regulatory framework for the use of stablecoins.
Can COIN stock continue to climb?
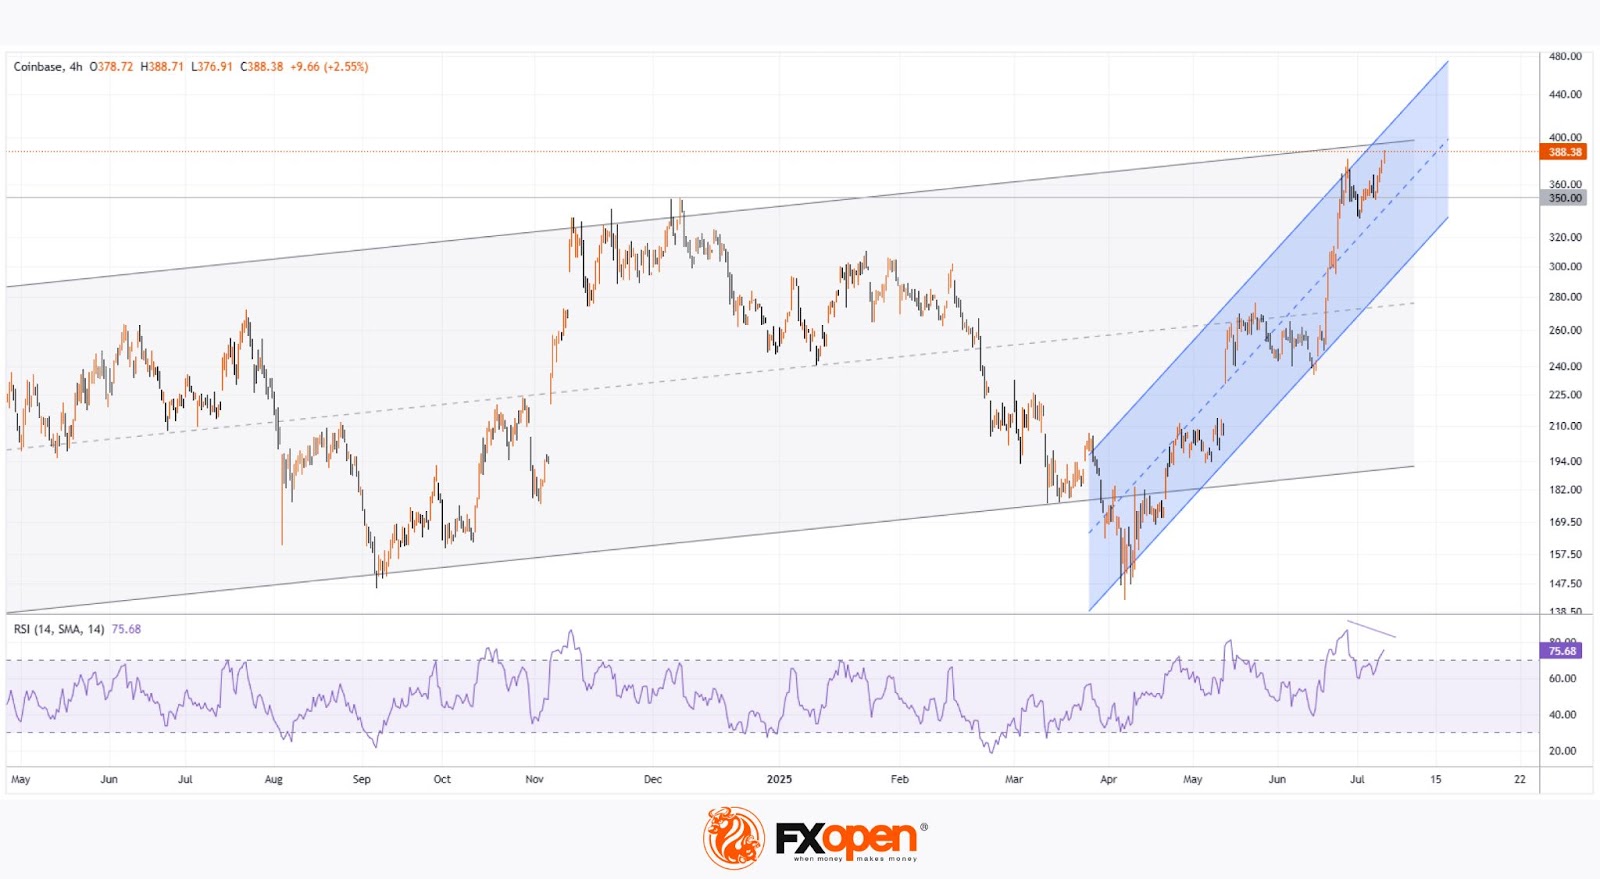
Technical Analysis of Coinbase (COIN) Share Price
At the end of June, our analysis of the COIN chart highlighted the following:
→ From a broader perspective, COIN’s price fluctuations over the past year had formed an ascending channel (marked in grey).
→ The ongoing intermediate rally (marked in blue) had the potential to drive the price towards the upper boundary of this grey channel.
This scenario has materialised: today, COIN shares are trading near the upper edge of the grey channel. However, several factors now warrant a bearish outlook:
→ The upper boundary of the channel may act as resistance;
→ The psychological level of $400 could also serve as resistance;
→ Shareholders may be tempted to lock in profits;
→ A potential bearish divergence on the RSI indicator.
It is possible that in the near term, COIN bulls will attempt to break through the $400 level. However, if buying momentum weakens, the conditions may favour a price correction — which would appear justified after a nearly 60% rally since early June.
Buy and sell stocks of the world's biggest publicly-listed companies with CFDs on FXOpen’s trading platform. Open your FXOpen account now or learn more about trading share CFDs with FXOpen.
This article represents the opinion of the Companies operating under the FXOpen brand only. It is not to be construed as an offer, solicitation, or recommendation with respect to products and services provided by the Companies operating under the FXOpen brand, nor is it to be considered financial advice.
Stay ahead of the market!
Subscribe now to our mailing list and receive the latest market news and insights delivered directly to your inbox.


Latest articles


Market Repricing of Risk as Gold Loses Safe-Haven Demand
Geopolitical tensions in the Middle East had remained the primary macro driver for the gold market over recent weeks; however, on 8 April the situation shifted sharply as the United States and Iran agreed to a temporary two-week ceasefire, including

Commodity Currencies on the Rise: Market Focus Shifts to US and Canadian Data
Commodity-linked currencies continue to strengthen, while the US dollar remains under pressure amid easing geopolitical tensions and a shift in investor preference towards riskier assets. Reports of a temporary ceasefire between the US and Iran have helped stabilise sentiment and