


FXOpen
Today, Germany's PMI data was released, according to Forex Factory:
→ German Flash Manufacturing PMI: actual = 42.6, expected = 40.7, previous = 40.6;
→ German Flash Services PMI: actual = 51.4, expected = 50.6, previous = 50.6.
The DAX 40 index (Germany 40 mini on FXOpen) showed a slight intraday increase, which could be viewed positively, especially given that last week, the index reached a yearly high.
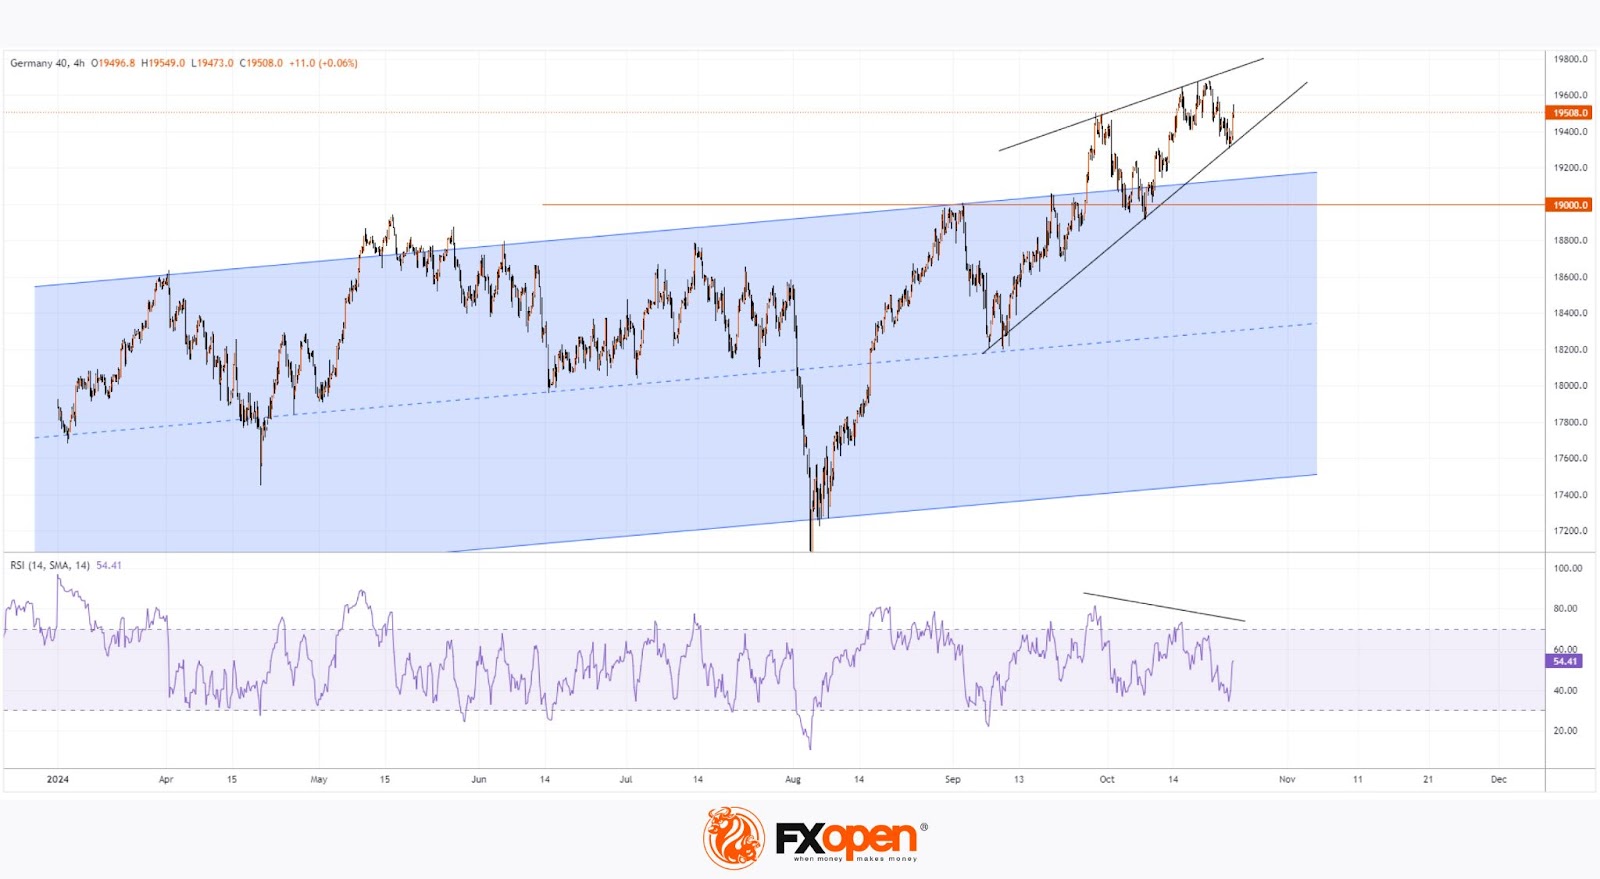
However, the chart for the DAX 40 (Germany 40 mini on FXOpen) shows signs of the upward momentum slowing:
→ The RSI indicator is showing bearish divergence;
→ Price fluctuations are forming a triangle that could turn into a bearish reversal pattern known as a Bearish Rising Wedge (marked by black lines).
If a bearish break below the lower black line occurs, it might indicate that the bulls failed to maintain the momentum above the blue channel, within which the DAX 40 index had fluctuated for most of 2024.
Thus, a potential pullback towards the psychological level of 19,000 should not be ruled out.
Trade global index CFDs with zero commission and tight spreads (additional fees may apply). Open your FXOpen account now or learn more about trading index CFDs with FXOpen.
This article represents the opinion of the Companies operating under the FXOpen brand only. It is not to be construed as an offer, solicitation, or recommendation with respect to products and services provided by the Companies operating under the FXOpen brand, nor is it to be considered financial advice.
Stay ahead of the market!
Subscribe now to our mailing list and receive the latest market news and insights delivered directly to your inbox.


Latest articles

Market Analysis: GBP/USD Dips Further As EUR/GBP Regains Traction
GBP/USD failed to climb above 1.3500 and corrected some gains. EUR/GBP started a decent increase and might aim for more gains above 0.8700.
Important Takeaways for GBP/USD and EUR/GBP Analysis Today
· The British Pound


Market Insights with Gary Thomson: Oil, US Retail Sales & NFP in Focus
In this video, we’ll explore the key economic events and market trends, shaping the financial landscape. Get ready for insights into financial markets to help you navigate the week ahead. Let’s dive in!
In this episode of Market