


Rising Wedge Pattern: Trading Rules and Strategies
FXOpen
Numerous technical analysis patterns indicate a reversal in market trends. A rising wedge is a formation that helps traders spot price reversals. This FXOpen article will explain how to identify a rising wedge to analyse market trends and explore whether it provides bullish or bearish signals.
What Does a Rising Wedge Signify?
A rising wedge, also known as the ascending wedge, is a technical analysis chart pattern. The wedge appears when the upper and lower trendlines connecting the higher highs and higher lows converge with the gap squeezing towards the intersecting point.
Is the ascending wedge bullish or bearish? It’s a bearish formation, which is usually considered a reversal setup that is formed in an uptrend, signalling a reversal of a market trend. Still, it can occur in a downtrend, signalling a continuation of an existing bearish trend. Buyers push the price from the downside and face resistance in breaking it towards the upside, which finally triggers a move in the opposite direction.
The pattern can appear on any timeframe. However, the larger the timeframe, the greater its effectiveness. Additionally, it can be applied to any asset class; for instance, you can spot an ascending wedge stock pattern or commodity, cryptocurrency*, and currency patterns. You will only need to adjust the parameters according to your trading strategy.
How Can You Spot a Rising Wedge Reversal Pattern?
Spotting a rising wedge chart pattern involves recognising a few distinctive features on a price chart. It typically appears after an uptrend and is characterised by two converging trendlines—one connecting the higher highs and the other linking the higher lows.
As the wedge narrows, the upward price movement shows signs of losing momentum. A critical aspect of this formation is the volume, which generally decreases as the wedge forms. This decline in volume suggests that the buying pressure is waning, setting the stage for a potential bearish reversal.
Besides the converging trendlines and decreasing volume, other technical indicators can provide additional confirmation for the rising wedge pattern. For instance, momentum oscillators like the Stochastic Oscillator or the Momentum indicator might show bearish divergence, reinforcing the setup's validity. It's also useful to consider the broader market context and any significant support or resistance levels that could impact the price action.
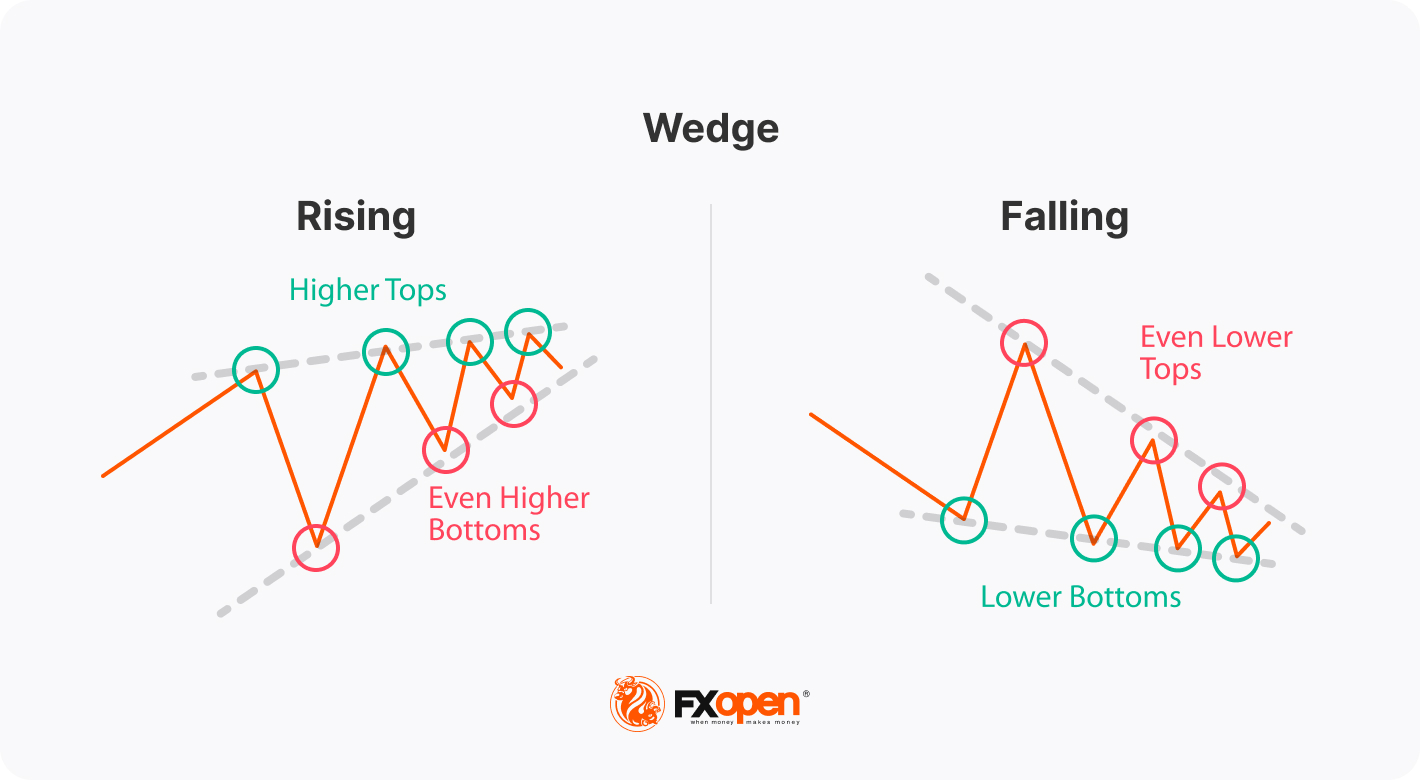
Falling and Rising Wedge: The Differences
Falling (descending) and rising (ascending) wedges are distinct technical patterns that signal different market movements.
A descending wedge occurs when both trendlines slope downwards, with the upper trendline descending more steeply than the lower one. It typically indicates a bullish reversal, as the price breaks upwards after a period of declining highs and lows.
Conversely, an ascending wedge pattern features upward-sloping trendlines, with the lower trendline rising more sharply. It usually means a bearish reversal, where the price breaks downwards following a phase of ascending highs and lows.
Both formations reflect a struggle between buyers and sellers, with the breakout direction revealing the dominant force.
How Can You Trade the Rising Wedge?
The rising wedge pattern in an uptrend indicates a price reversal. Meanwhile, in a downtrend, it indicates the continuation of the prevailing bearish trend. However, the trading rules are the same in both cases.
- Entry
The bearish rising wedge pattern suggests that traders go short when the price breaks its lower boundary. Depending upon whether they have a conservative or risky approach, traders wait for a few candlesticks after the breakdown to close or open a short position as soon as the breakout occurs, respectively.
Using other technical indicators with the pattern is useful to confirm its validity. For example, the Fibonacci retracement can be used to identify a price direction. The price retracing up to 50 to 61.8% of the previous downtrend and facing resistance there may indicate that the chart formation could lead to a downside breakout.
- Take Profit
The common take-profit target equals the height of the pattern’s widest part and is measured by subtracting the same distance from the breakout point. The target is often reached quickly in comparison with the time taken for the wedge’s formation.
- Stop Loss
Traders often use the risk-reward ratio of 1:2 or 1:3, depending on their risk appetite. Larger stop losses can lead to unfavourable risk-reward ratios, thereby significantly increasing risk exposure; hence, traders can use the upper trendline to place a stop loss just near it.
The rules are general, and the traders can adjust the parameters according to their own trading style. You can try TickTrader, FXOpen’s free trading platform, to learn how to identify different chart formations in the live market.
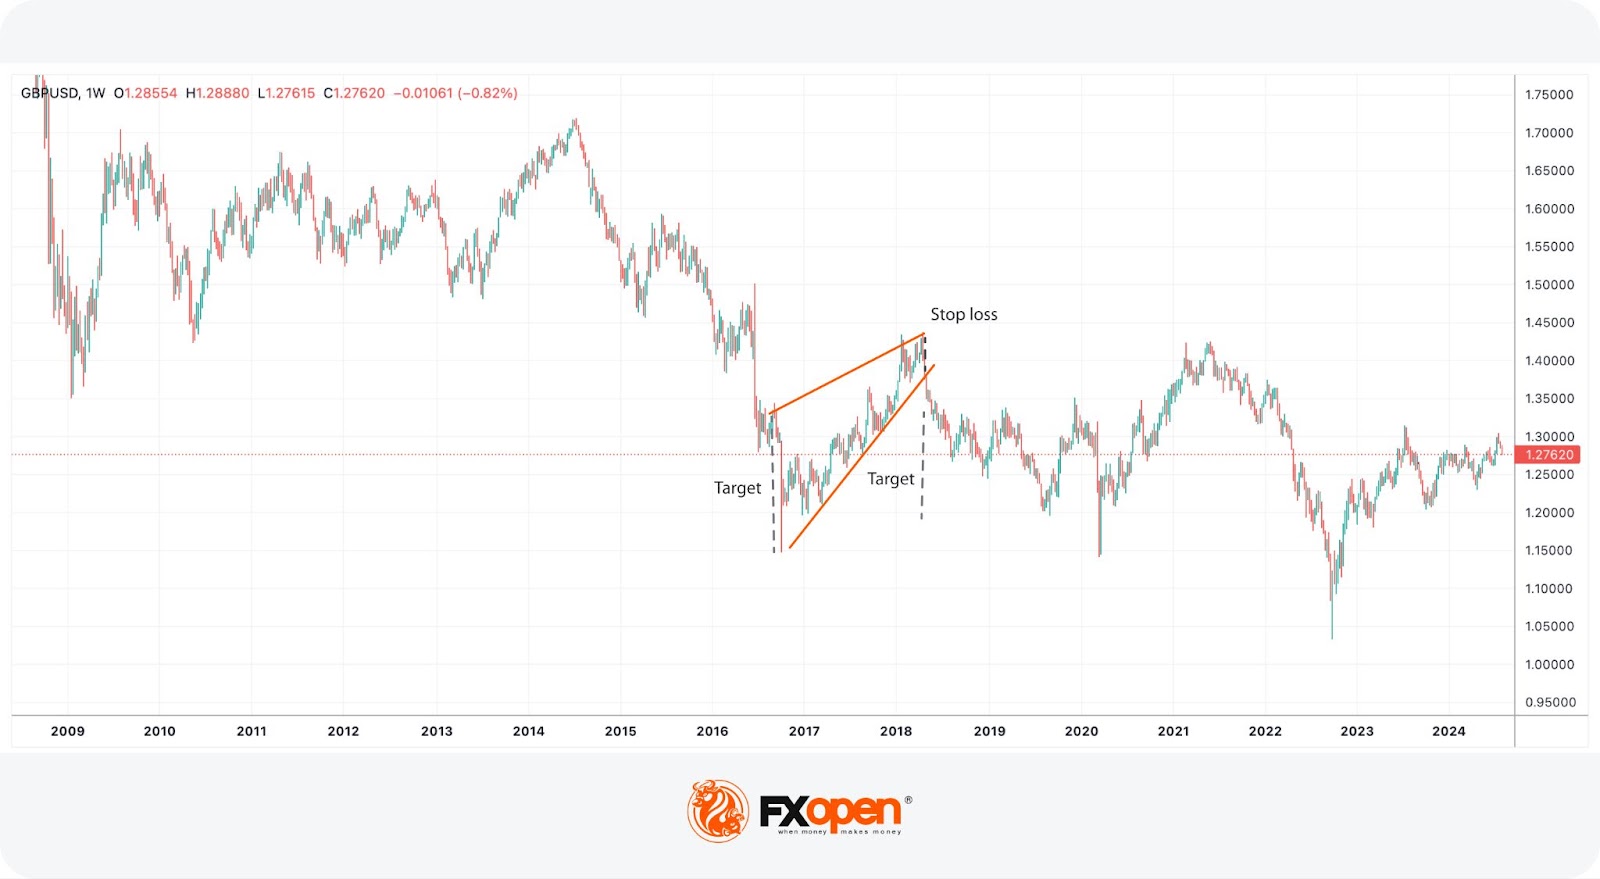
Rising Wedge: Trading Example
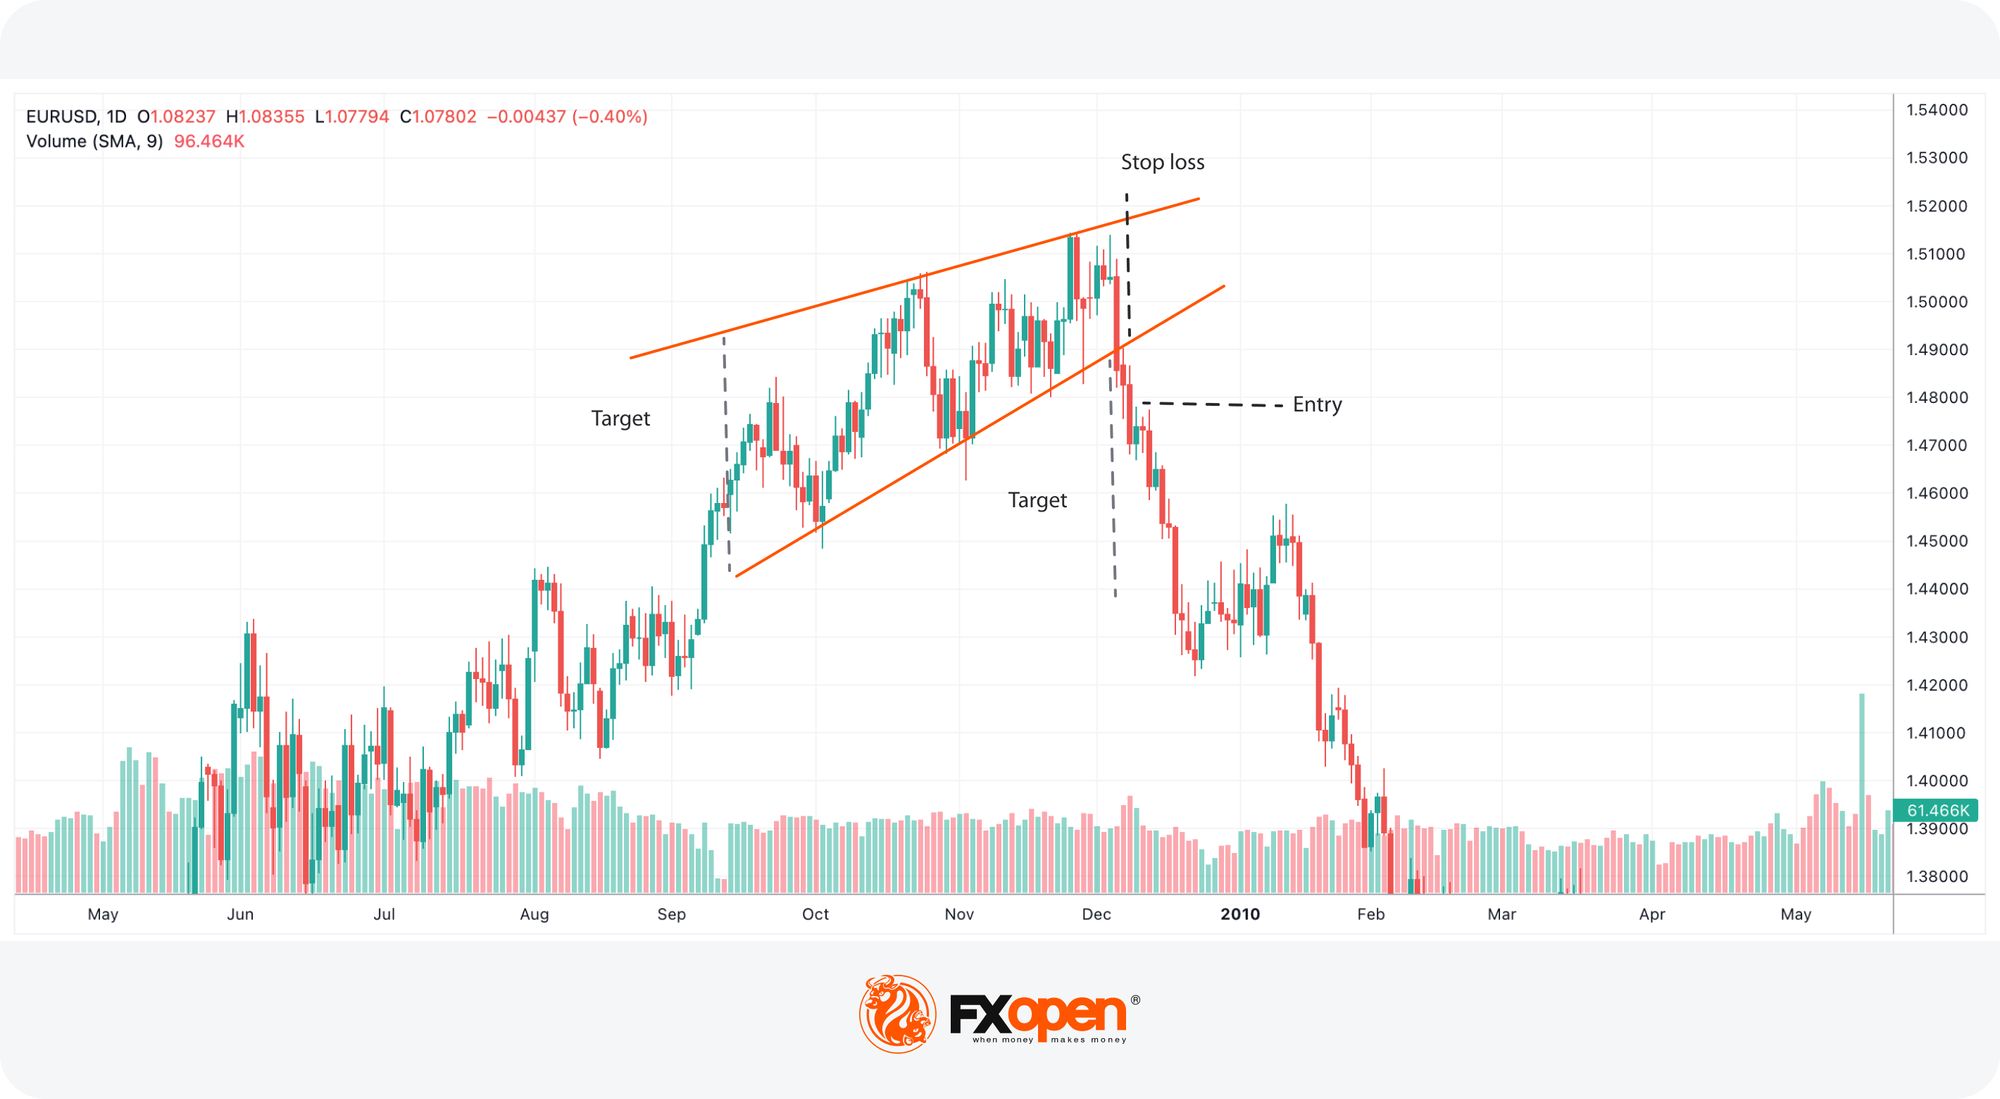
On the chart above, the ascending wedge was at the top of the uptrend. A trader opened a short trade on the candles following the breakout as the bearish volumes increased. A take-profit order was equal to the height of the widest part of the pattern. A stop-loss order was placed above the wedge’s upper boundary according to the risk/reward ratio.
Although the ascending wedge usually appears at the top of the upward trend, it can be found in a downtrend and signal its continuation.
On the chart above, the pattern formed in a downward trend with bulls trying to push the price from the downside but facing resistance at the higher level. The gap squeezed as the two trendlines converged, finally leading to a breakdown.
A trader went short when the breakout candle closed below the lower boundary and placed the stop loss slightly above the upper trendline in accordance with the risk/reward ratio. The take-profit target was the size of the largest part of the pattern subtracted from the breakout point.
Rising Wedge and Other Patterns
Finally, let’s compare the rising wedge with other patterns.
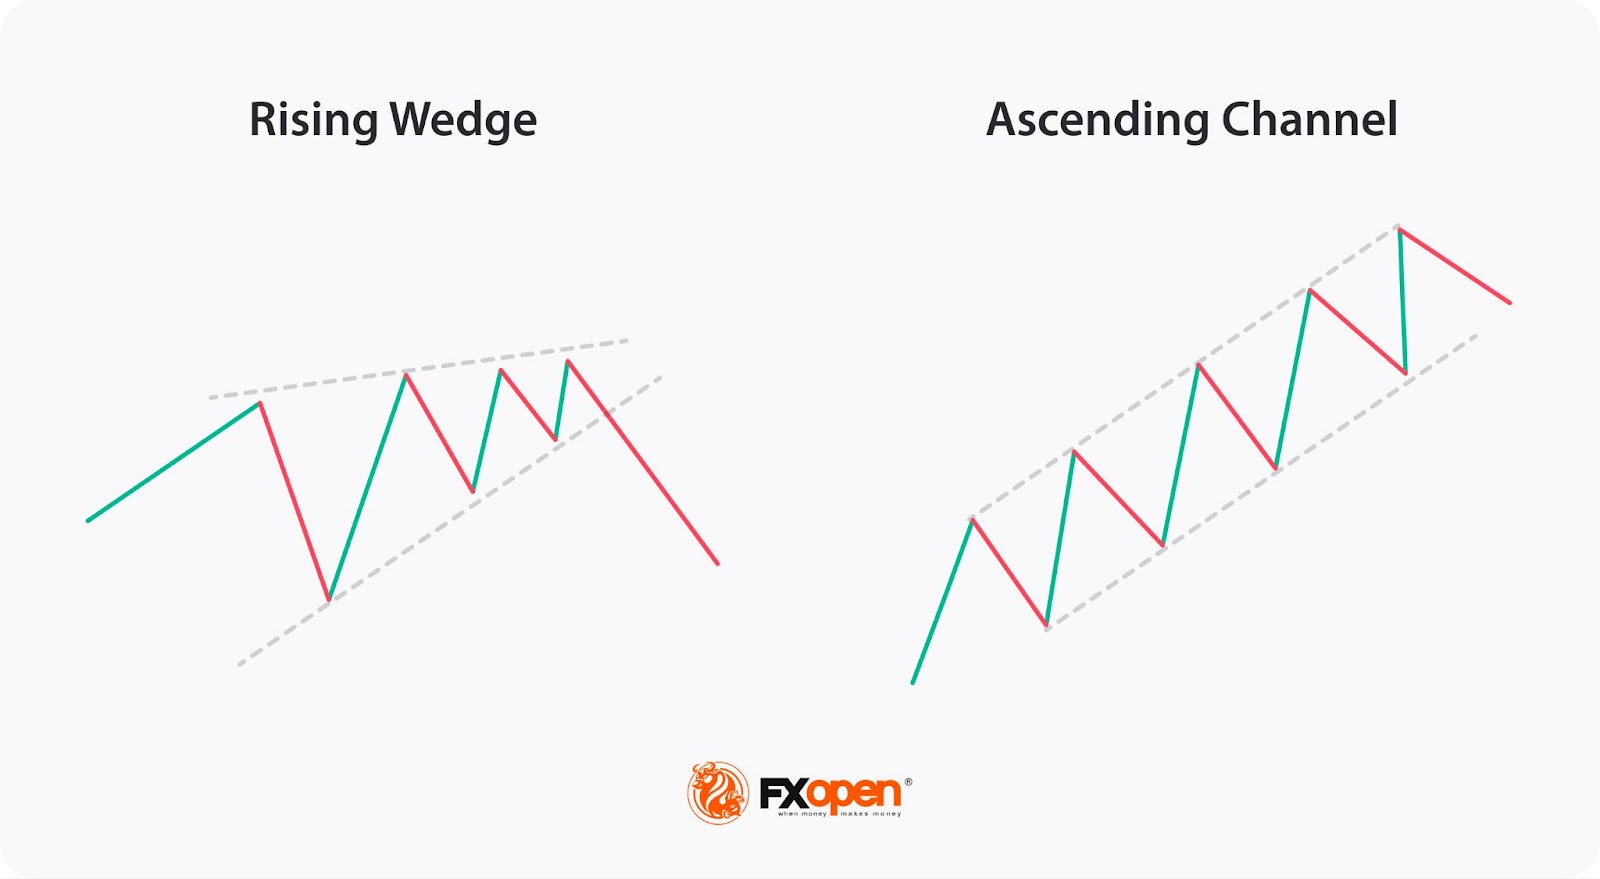
What Is the Difference Between a Rising Wedge and an Ascending Channel?
A rising wedge and an ascending channel are both upward-sloping formations, but they differ in structure and implications. A rising wedge has converging trendlines, indicating that the price highs and lows are coming closer together, suggesting weakening momentum and a potential bearish reversal.
In contrast, an ascending channel has parallel trendlines, reflecting steady, consistent price increases. The channel signifies a strong, ongoing uptrend with no immediate reversal signals.
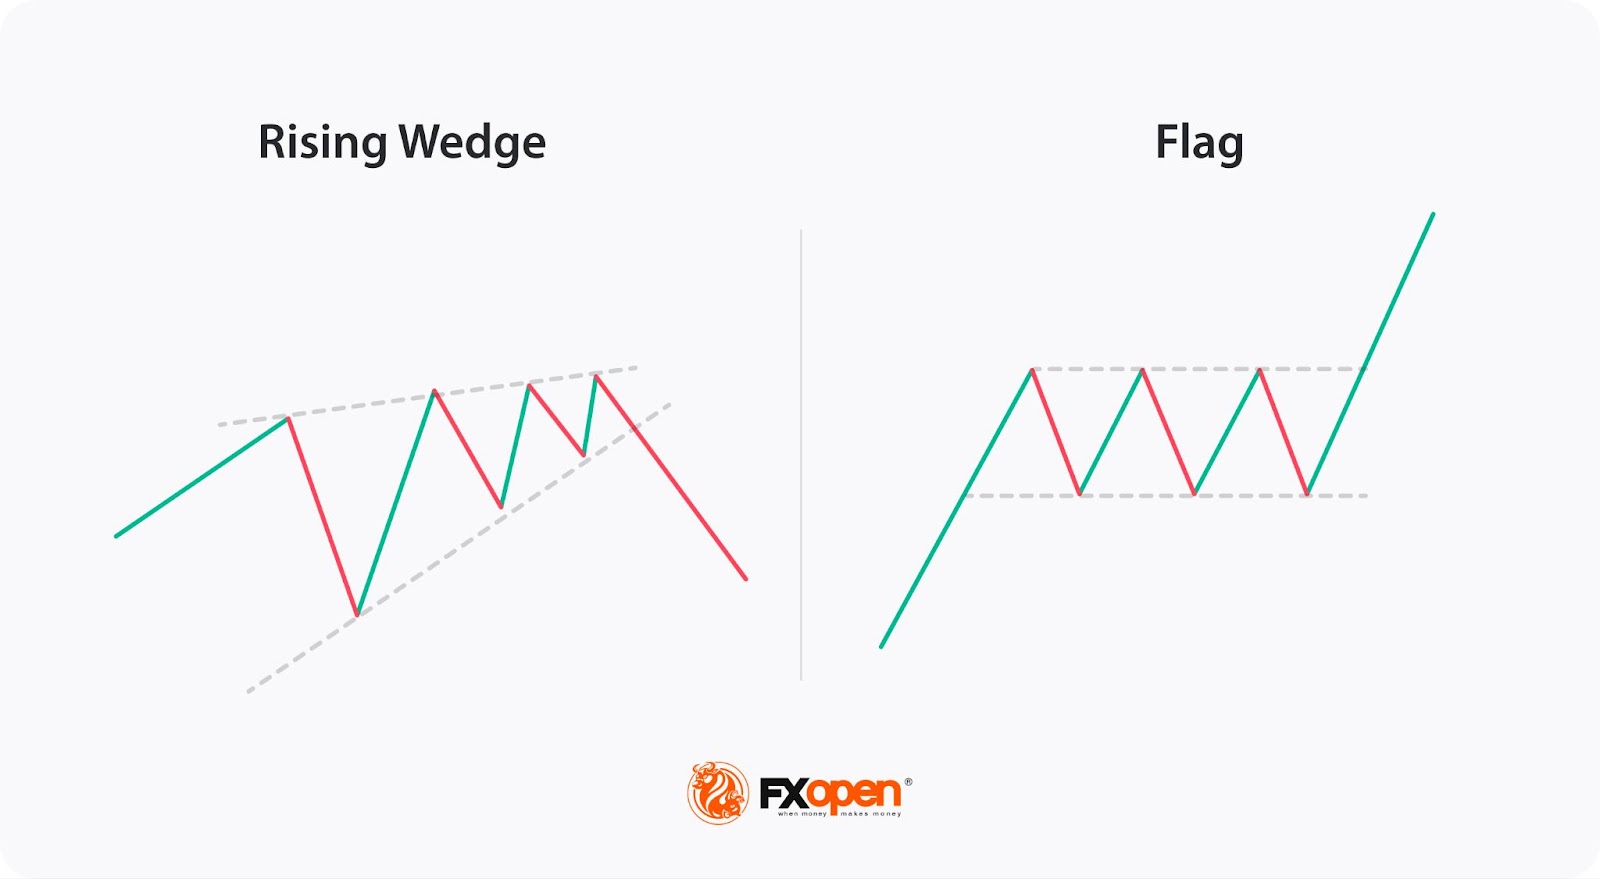
What Is the Difference Between a Rising Wedge and a Bullish Flag?
A rising wedge and a bullish flag both occur in uptrends but signal different outcomes. The rising wedge features converging trendlines and typically appears before a bearish reversal due to declining upward momentum.
On the other hand, a bullish flag consists of parallel trendlines sloping downwards or sideways after a strong upward move, resembling a flag on a pole. It suggests a continuation of the uptrend once the price breaks above the upper trendline, indicating that the initial bullish momentum is likely to resume.
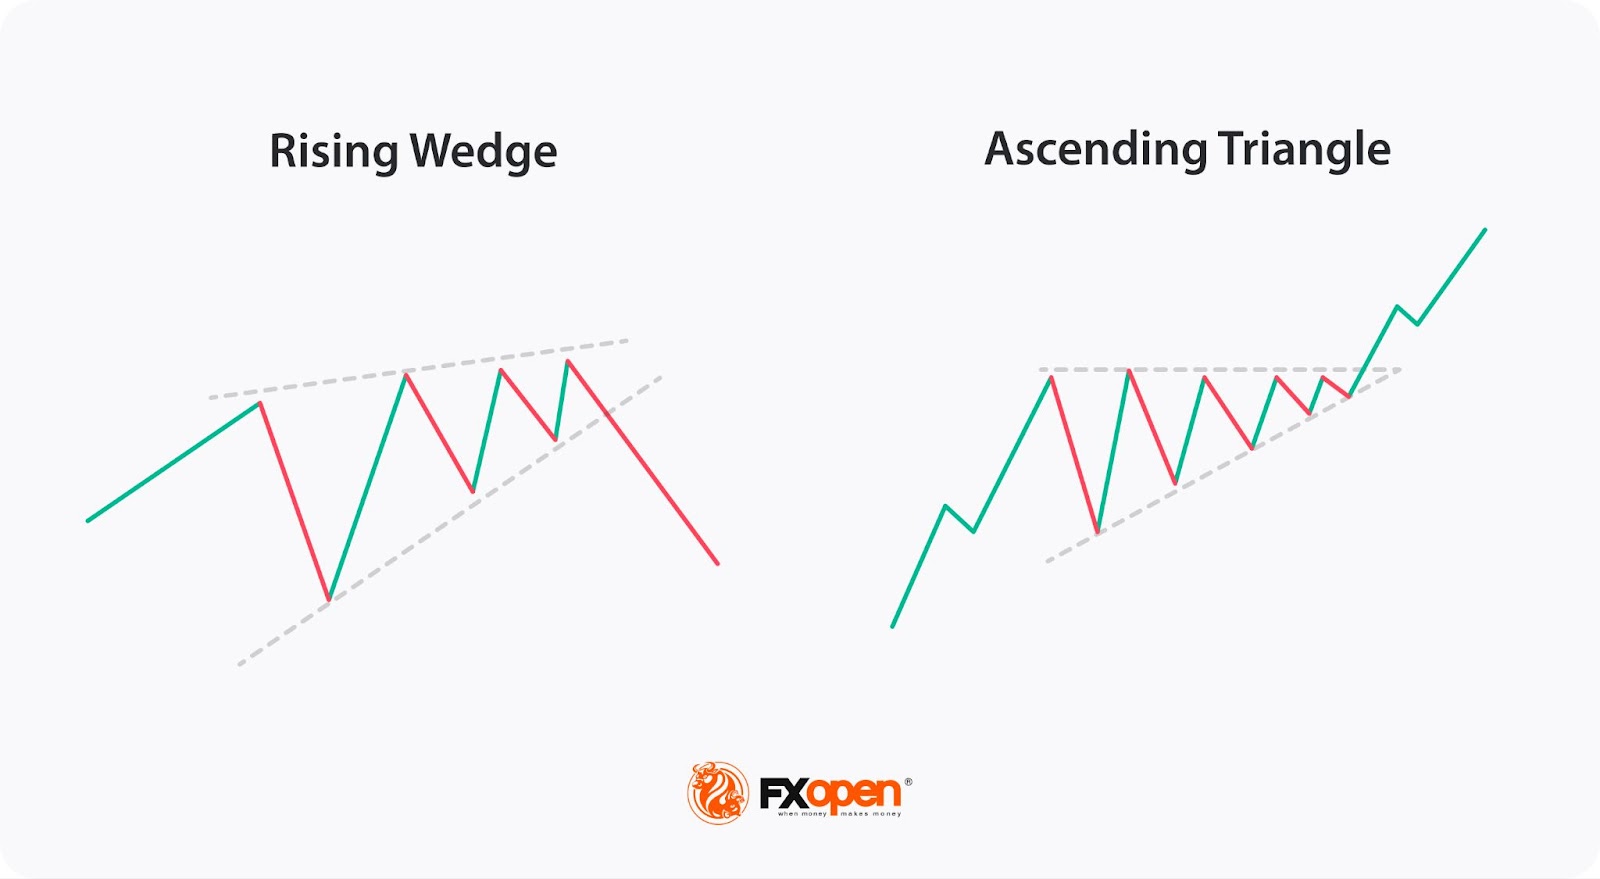
What Is the Difference Between a Rising Wedge and a Ascending Triangle?
A rising wedge and a rising triangle are both upward-sloping patterns but with different implications. The rising wedge has converging trendlines, signalling a bearish reversal.
Conversely, an ascending triangle features a horizontal upper trendline and an ascending lower trendline, indicating that buyers are progressively pushing prices higher. It is generally bullish, signalling a likely breakout above the horizontal resistance, leading to further price increases.
The Bottom Line
The rising wedge is among the most popular technical analysis formations that traders use to identify trading opportunities. However, traders can’t be 100% sure that it will work all the time; hence, it should be used in conjunction with other technical indicators, and the risk must be properly defined.
Open an FXOpen account to apply your own trading techniques on over 600 markets and enjoy tight spreads from 0.0 pips and low commission from $1.50 per lot.
FAQ
What Does a Rising Wedge Indicate?
A rising wedge, or ascending wedge, indicates a potential reversal in an uptrend. It forms when prices make higher highs and higher lows, but the upward momentum weakens, leading to converging trendlines. This formation often suggests that buying pressure is diminishing, and a bearish reversal may occur when the price breaks below the lower trendline. It can be found as a rising wedge stock pattern or as a crypto*, commodity, or currency pattern.
Is a Rising Wedge Bullish or Bearish?
A rising wedge is generally considered bearish. Although it forms during an uptrend, the pattern indicates weakening momentum. As the price approaches the point where the trendlines converge, the likelihood of a downward breakout increases, signalling a potential reversal to a bearish trend.
What Is a Rising Wedge Price Target?
The price target for a rising wedge is typically determined by measuring the height of the wedge at its widest point and subtracting this distance from the breakout level. This method provides an estimate of the potential downside movement following the bearish breakout.
How to Trade a Rising Wedge?
Trading a rising wedge involves identifying the pattern and waiting for a confirmed breakout below the lower trendline. Traders often enter a short position at the breakout and use other technical indicators for confirmation. Stop-loss orders are usually placed just above the upper trendline.
*At FXOpen UK and FXOpen AU, Cryptocurrency CFDs are only available for trading by those clients categorised as Professional clients under FCA Rules and Professional clients under ASIC Rules, respectively. They are not available for trading by Retail clients.
This article represents the opinion of the Companies operating under the FXOpen brand only. It is not to be construed as an offer, solicitation, or recommendation with respect to products and services provided by the Companies operating under the FXOpen brand, nor is it to be considered financial advice.
Stay ahead of the market!
Subscribe now to our mailing list and receive the latest market news and insights delivered directly to your inbox.


Latest articles

Weekly Market Insights with Gary Thomson: The Week of Central Banks and Earnings
In this video, we’ll explore the key economic events and market trends, shaping the financial landscape. Get ready for insights into financial markets to help you navigate the week ahead. Let’s dive in!
In this episode of Market

Intel at a Crossroads: Earnings Beat Meets Technical Resistance
Intel has just delivered its strongest quarter in over fifteen years, and the market reaction says it all. Q2 2026 revenue surged 25% year-over-year to $16.1 billion, crushing the consensus estimate of $14.42 billion, while adjusted EPS of

Tesla: Complex Range Structure Breaks Down Following Quarterly Earnings
Tesla released its Q2 2026 results after the market closed on 22 July. Revenue increased 26% year-on-year to $28.24 billion, while vehicle deliveries reached a record 480,126 units. However, operating margin fell sharply to 1.4%, down from