


Dollar Index Chart Analysis After the Fed Decision
FXOpen

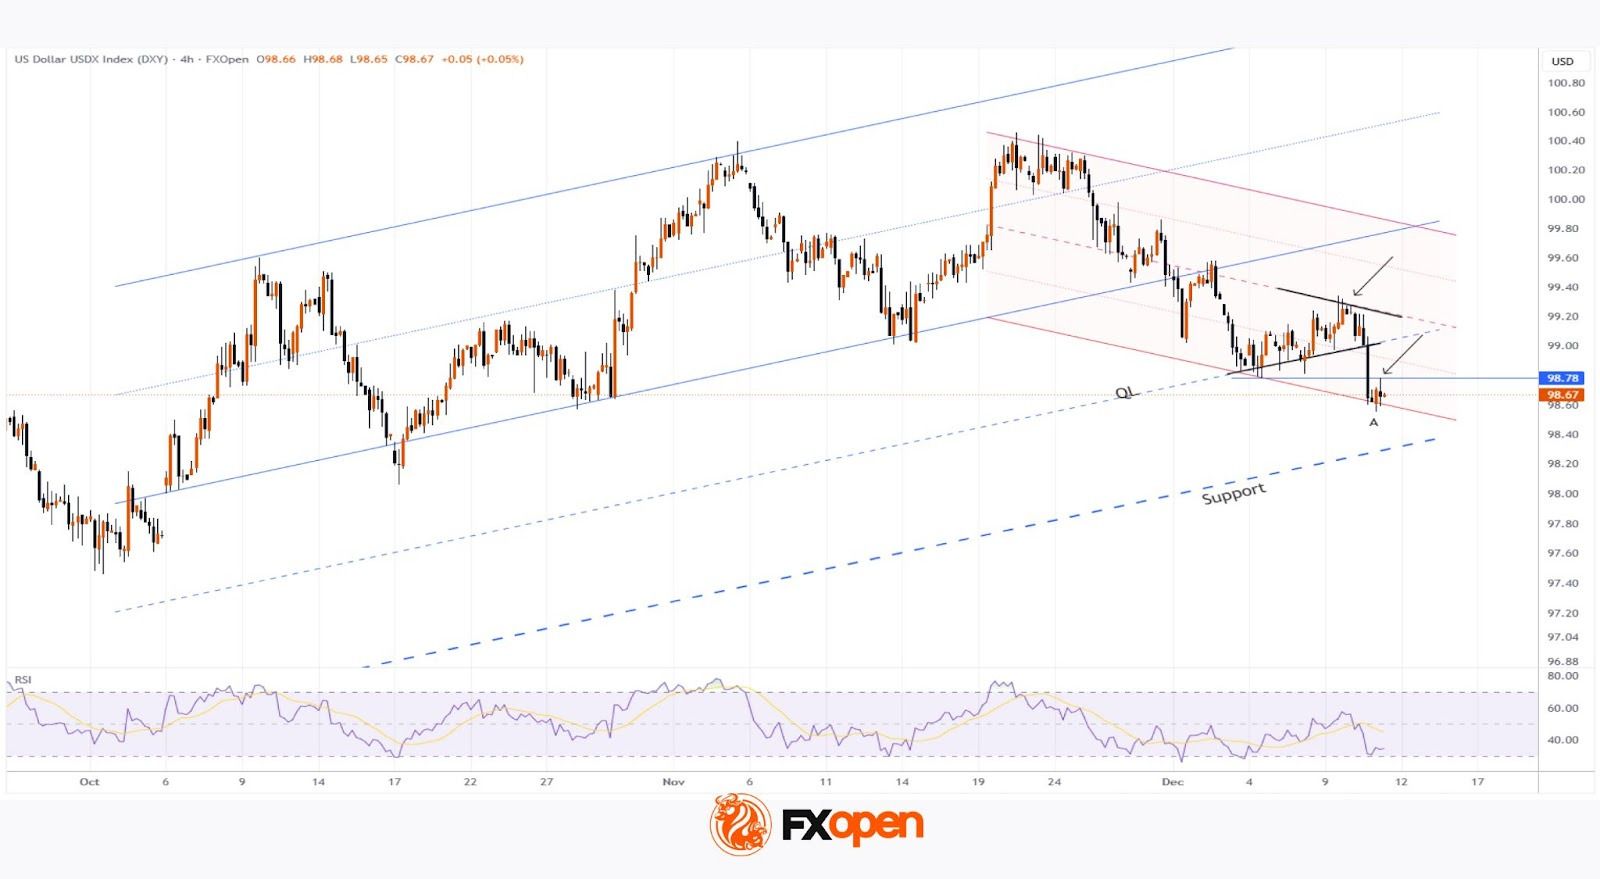
Following yesterday’s FOMC interest rate decision and Jerome Powell’s press conference, the US Dollar Index (DXY) dropped sharply to point A.
On one hand, the 0.25% rate cut makes the dollar less attractive for capital preservation and yield. On the other, the prospect of a pause before further cuts provides some support.
Thus, the current level represents the market’s attempt to establish a fair valuation for the US currency.
Technical Analysis of the DXY Chart
Three days ago, we:
→ updated the system of two trend channels;
→ noted signs of seller dominance;
→ highlighted the formation of a consolidation zone.
Yesterday’s decline prompted an extension of the blue upward channel formed in October–November. Key insights from recent price action include:
→ the consolidation zone (marked by black lines) was broken after the median of the red channel acted as resistance (indicated by the arrow);
→ the price fell to the lower boundary of the red channel;
→ the former support around 98.78 acted as resistance this morning (marked by the second arrow);
→ the RSI indicator is near oversold levels, reflecting ongoing selling pressure.
Considering the above, a scenario of further downward movement along the lower boundary of the red channel seems plausible. If this develops, the price may fall to the lower boundary of the blue channel, which could serve as a key support level.
Trade global index CFDs with zero commission and tight spreads (additional fees may apply). Open your FXOpen account now or learn more about trading index CFDs with FXOpen.
This article represents the opinion of the Companies operating under the FXOpen brand only. It is not to be construed as an offer, solicitation, or recommendation with respect to products and services provided by the Companies operating under the FXOpen brand, nor is it to be considered financial advice.
Stay ahead of the market!
Subscribe now to our mailing list and receive the latest market news and insights delivered directly to your inbox.


Latest articles

CAD/JPY: The Yen's Most Historic Move in 30 Years Meets a Fragile Support
Two central banks are heading in genuinely opposite directions this week, and the tension is unmistakable. The Bank of Canada held rates steady at 2.25% on September 2, with a mildly hawkish tilt as policymakers acknowledged a broadening economic

USD/JPY and USD/CAD Await Key Fed Decision
The US dollar is consolidating against the yen and Canadian dollar ahead of the key event of the week — the Federal Reserve meeting. The Fed is widely expected to raise its policy rate by 25 basis points to a range

UnitedHealth: Fundamentals Are Healing, Now the Chart Must Agree
UnitedHealth finds itself in a genuinely split narrative right now, trading near $388, down about 15.9% from its 52-week high, even as the fundamental picture keeps improving. Q2 earnings beat expectations, with revenue of $112.03 billion, and the