


FXOpen

Today, the dollar index rose above last week’s peak around the 99.68 level, setting a new high for 2026. This movement is supported by a tense fundamental backdrop:
→ Inflationary pressures from rising oil prices. Markets may be pricing in a “higher for longer” scenario, with elevated Fed rates persisting.
→ Safe-haven demand. Escalation in the Middle East—including strikes on Iran and the rise of hardline leader Mojtaba Khamenei in Tehran—may push market participants towards defensive strategies and the US dollar.
→ Weakness in other currencies. The Middle East conflict can weigh on the yen and euro, as European and Japanese economies remain highly sensitive to energy prices.
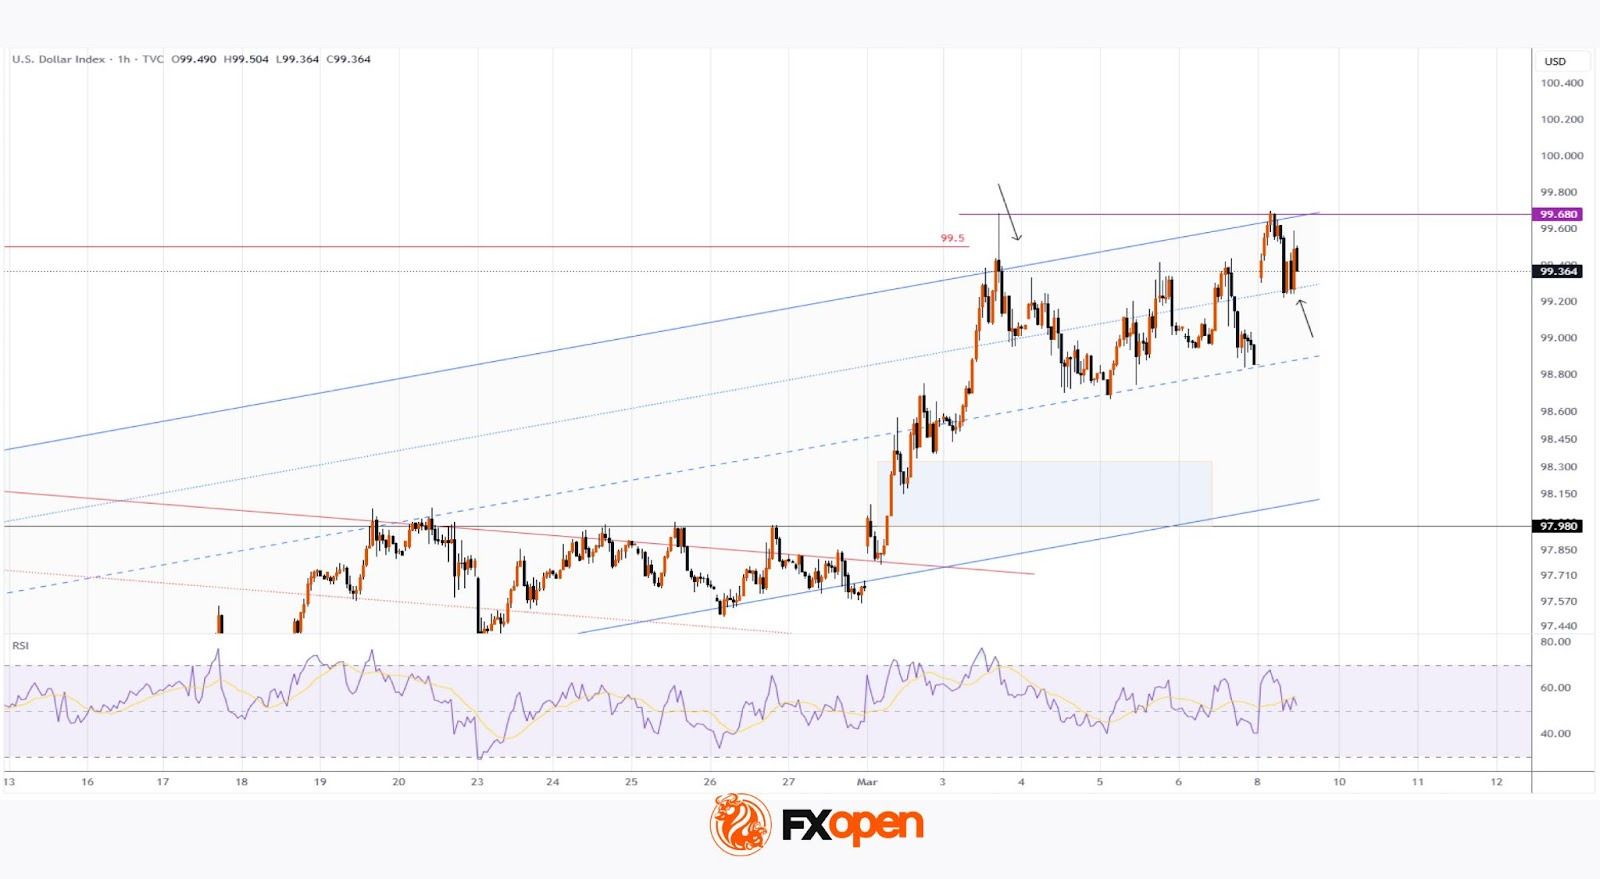
Technical Analysis of the DXY Chart
On the morning of 3 March, analysing the DXY chart, we:
→ drew an ascending channel (highlighted in blue);
→ anticipated that military escalation could drive the DXY index to the upper boundary of the channel.
Indeed, on the same day, the dollar index surged:
→ breaking above the channel’s upper boundary;
→ the RSI indicator entered overbought territory;
→ price slightly exceeded the January peak, signalling a possible bull trap.
As indicated by the first arrow, a long upper wick formed at the peak on 3 March, showing seller activity around the 99.60 level. Today’s brief surpassing of last week’s peak confirms this thesis, resembling a Liquidity Grab pattern.
On the other hand, buyers:
→ demonstrated strength at the market open (the bullish gap may continue to act as support);
→ can rely on support from the line dividing the upper half of the channel into two quarters (shown by the second arrow).
Traders should therefore be prepared for a scenario where DXY fluctuations show signs of stabilising near the yearly highs. Key developments around Iran are likely to have the strongest influence on the evolving balance.
Trade global index CFDs with zero commission and tight spreads (additional fees may apply). Open your FXOpen account now or learn more about trading index CFDs with FXOpen.
This article represents the opinion of the Companies operating under the FXOpen brand only. It is not to be construed as an offer, solicitation, or recommendation with respect to products and services provided by the Companies operating under the FXOpen brand, nor is it to be considered financial advice.
Stay ahead of the market!
Subscribe now to our mailing list and receive the latest market news and insights delivered directly to your inbox.


Latest articles

The Real Driver Behind the Dollar Rally: Market Insights with Gary Thomson
The US dollar has been firm, but the drivers behind the move may be more complex than they first appear.
While geopolitical tension and shifts in risk sentiment play a role, current price behaviour seems increasingly influenced by inflation expectations

EUR/USD and USD/CHF Pull Back: Market Reacts to Fundamentals
European currencies have shown a recovery in recent trading sessions after their recent decline, displaying early signs of a reversal. The US dollar is weakening amid expectations surrounding upcoming US macroeconomic data, while market participants are reassessing their short-term positions

Weak Data Weigh on the Dollar: Market Awaits Trend Confirmation
The US dollar is retreating from recent highs, moving into a moderate correction after a prolonged period of gains. Pressure on the currency is building amid weaker-than-expected macroeconomic data, while market participants adopt a wait-and-see approach ahead of key labour