


FXOpen

As the Dollar Index (DXY) chart shows, the index is currently trading below its 5 November high, which formed after a false bullish breakout (marked by an arrow) above the 1 August peak — a scenario previously outlined in the post “The Dollar Index Near a Key High.”
According to Trading Economics, trader sentiment at the start of the week is being shaped by expectations of comments from ECB and Federal Reserve officials regarding the outlook for monetary policy.
A statement has already come from Reserve Bank of Australia Deputy Governor Andrew Hauser, who noted that financial conditions in the country are now close to a neutral rate — one that neither stimulates nor restrains economic growth. The Australian dollar strengthened following his remarks.
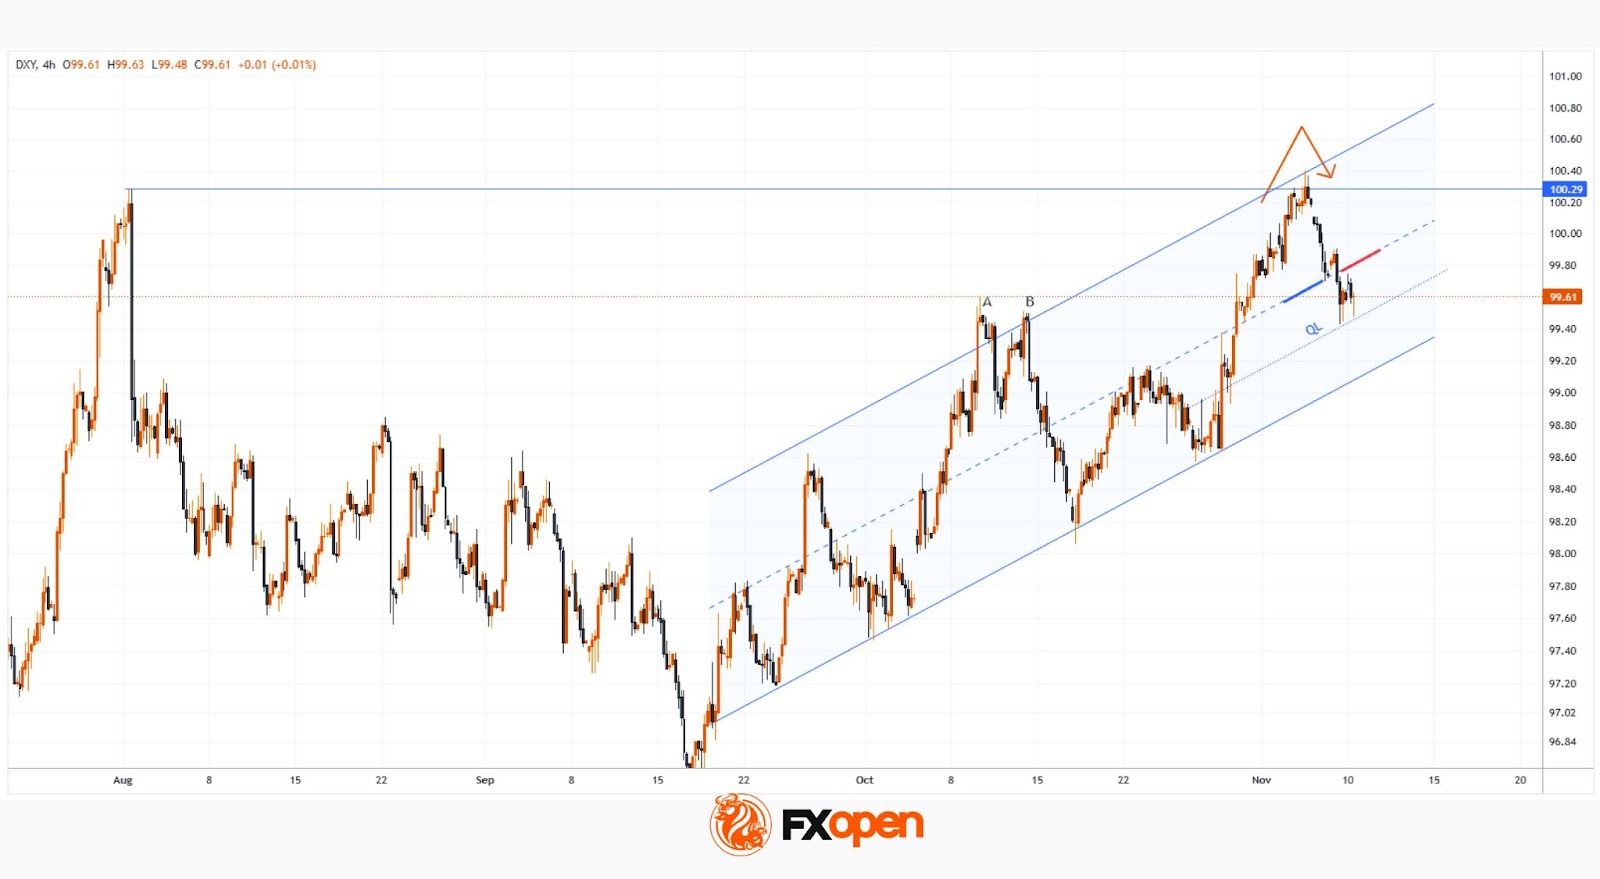
Technical Analysis of the DXY Chart
The previously drawn ascending channel remains relevant for the Dollar Index, with several important technical features:
→ The channel median has switched its role from support to resistance (as indicated by its colour change from blue to red).
→ The QL line, which divides the lower half of the channel into quarters, is currently acting as support for the DXY.
→ The index has fallen below the psychological level of 100 points.
It appears that the 3.7% rally in the Dollar Index since mid-September has attracted sellers, while late buyers may have been trapped near the top of the recent move.
Additional support may be found near 99.45, where a double-top pattern (A–B) previously formed. However, if this level is breached, the DXY could extend its decline towards the lower boundary of the channel.
Trade global index CFDs with zero commission and tight spreads (additional fees may apply). Open your FXOpen account now or learn more about trading index CFDs with FXOpen.
This article represents the opinion of the Companies operating under the FXOpen brand only. It is not to be construed as an offer, solicitation, or recommendation with respect to products and services provided by the Companies operating under the FXOpen brand, nor is it to be considered financial advice.
Stay ahead of the market!
Subscribe now to our mailing list and receive the latest market news and insights delivered directly to your inbox.


Latest articles

Consolidation Ahead of NFP: Commodity Currencies Search for Direction
Commodity-linked currencies have entered a consolidation phase following recent directional moves, as market participants adopt a wait-and-see approach ahead of key US labour market data. Current price action reflects a balance between ongoing demand for the US dollar and attempts

The Real Driver Behind the Dollar Rally: Market Insights with Gary Thomson
The US dollar has been firm, but the drivers behind the move may be more complex than they first appear.
While geopolitical tension and shifts in risk sentiment play a role, current price behaviour seems increasingly influenced by inflation expectations

EUR/USD and USD/CHF Pull Back: Market Reacts to Fundamentals
European currencies have shown a recovery in recent trading sessions after their recent decline, displaying early signs of a reversal. The US dollar is weakening amid expectations surrounding upcoming US macroeconomic data, while market participants are reassessing their short-term positions