


FXOpen

The daily E-mini S&P 500 chart shows that the ATR indicator (14) is in the 2023 lows, dropping below the value of 40.
What can low values of the ATR indicator mean, indicating a decrease in volatility?
1→ Remember the proverb “Sell in May and Go Away”, implying that the stock market is usually inactive starting from May. Are traders already on vacation after the main part of the reporting season? It is unlikely that the solution to the problem with the US public debt lies ahead. Already today, Tuesday, President Biden held talks with representatives of Congress on this matter.
2→ An important trend is brewing in the E-mini S&P 500 futures market. Notice the low ATR values at the end of 2021, followed by a massive decline. The market periodically changes its state: from flat (when reversal strategies work) → to trend (when breakout strategies work) → and so on ad infinitum.
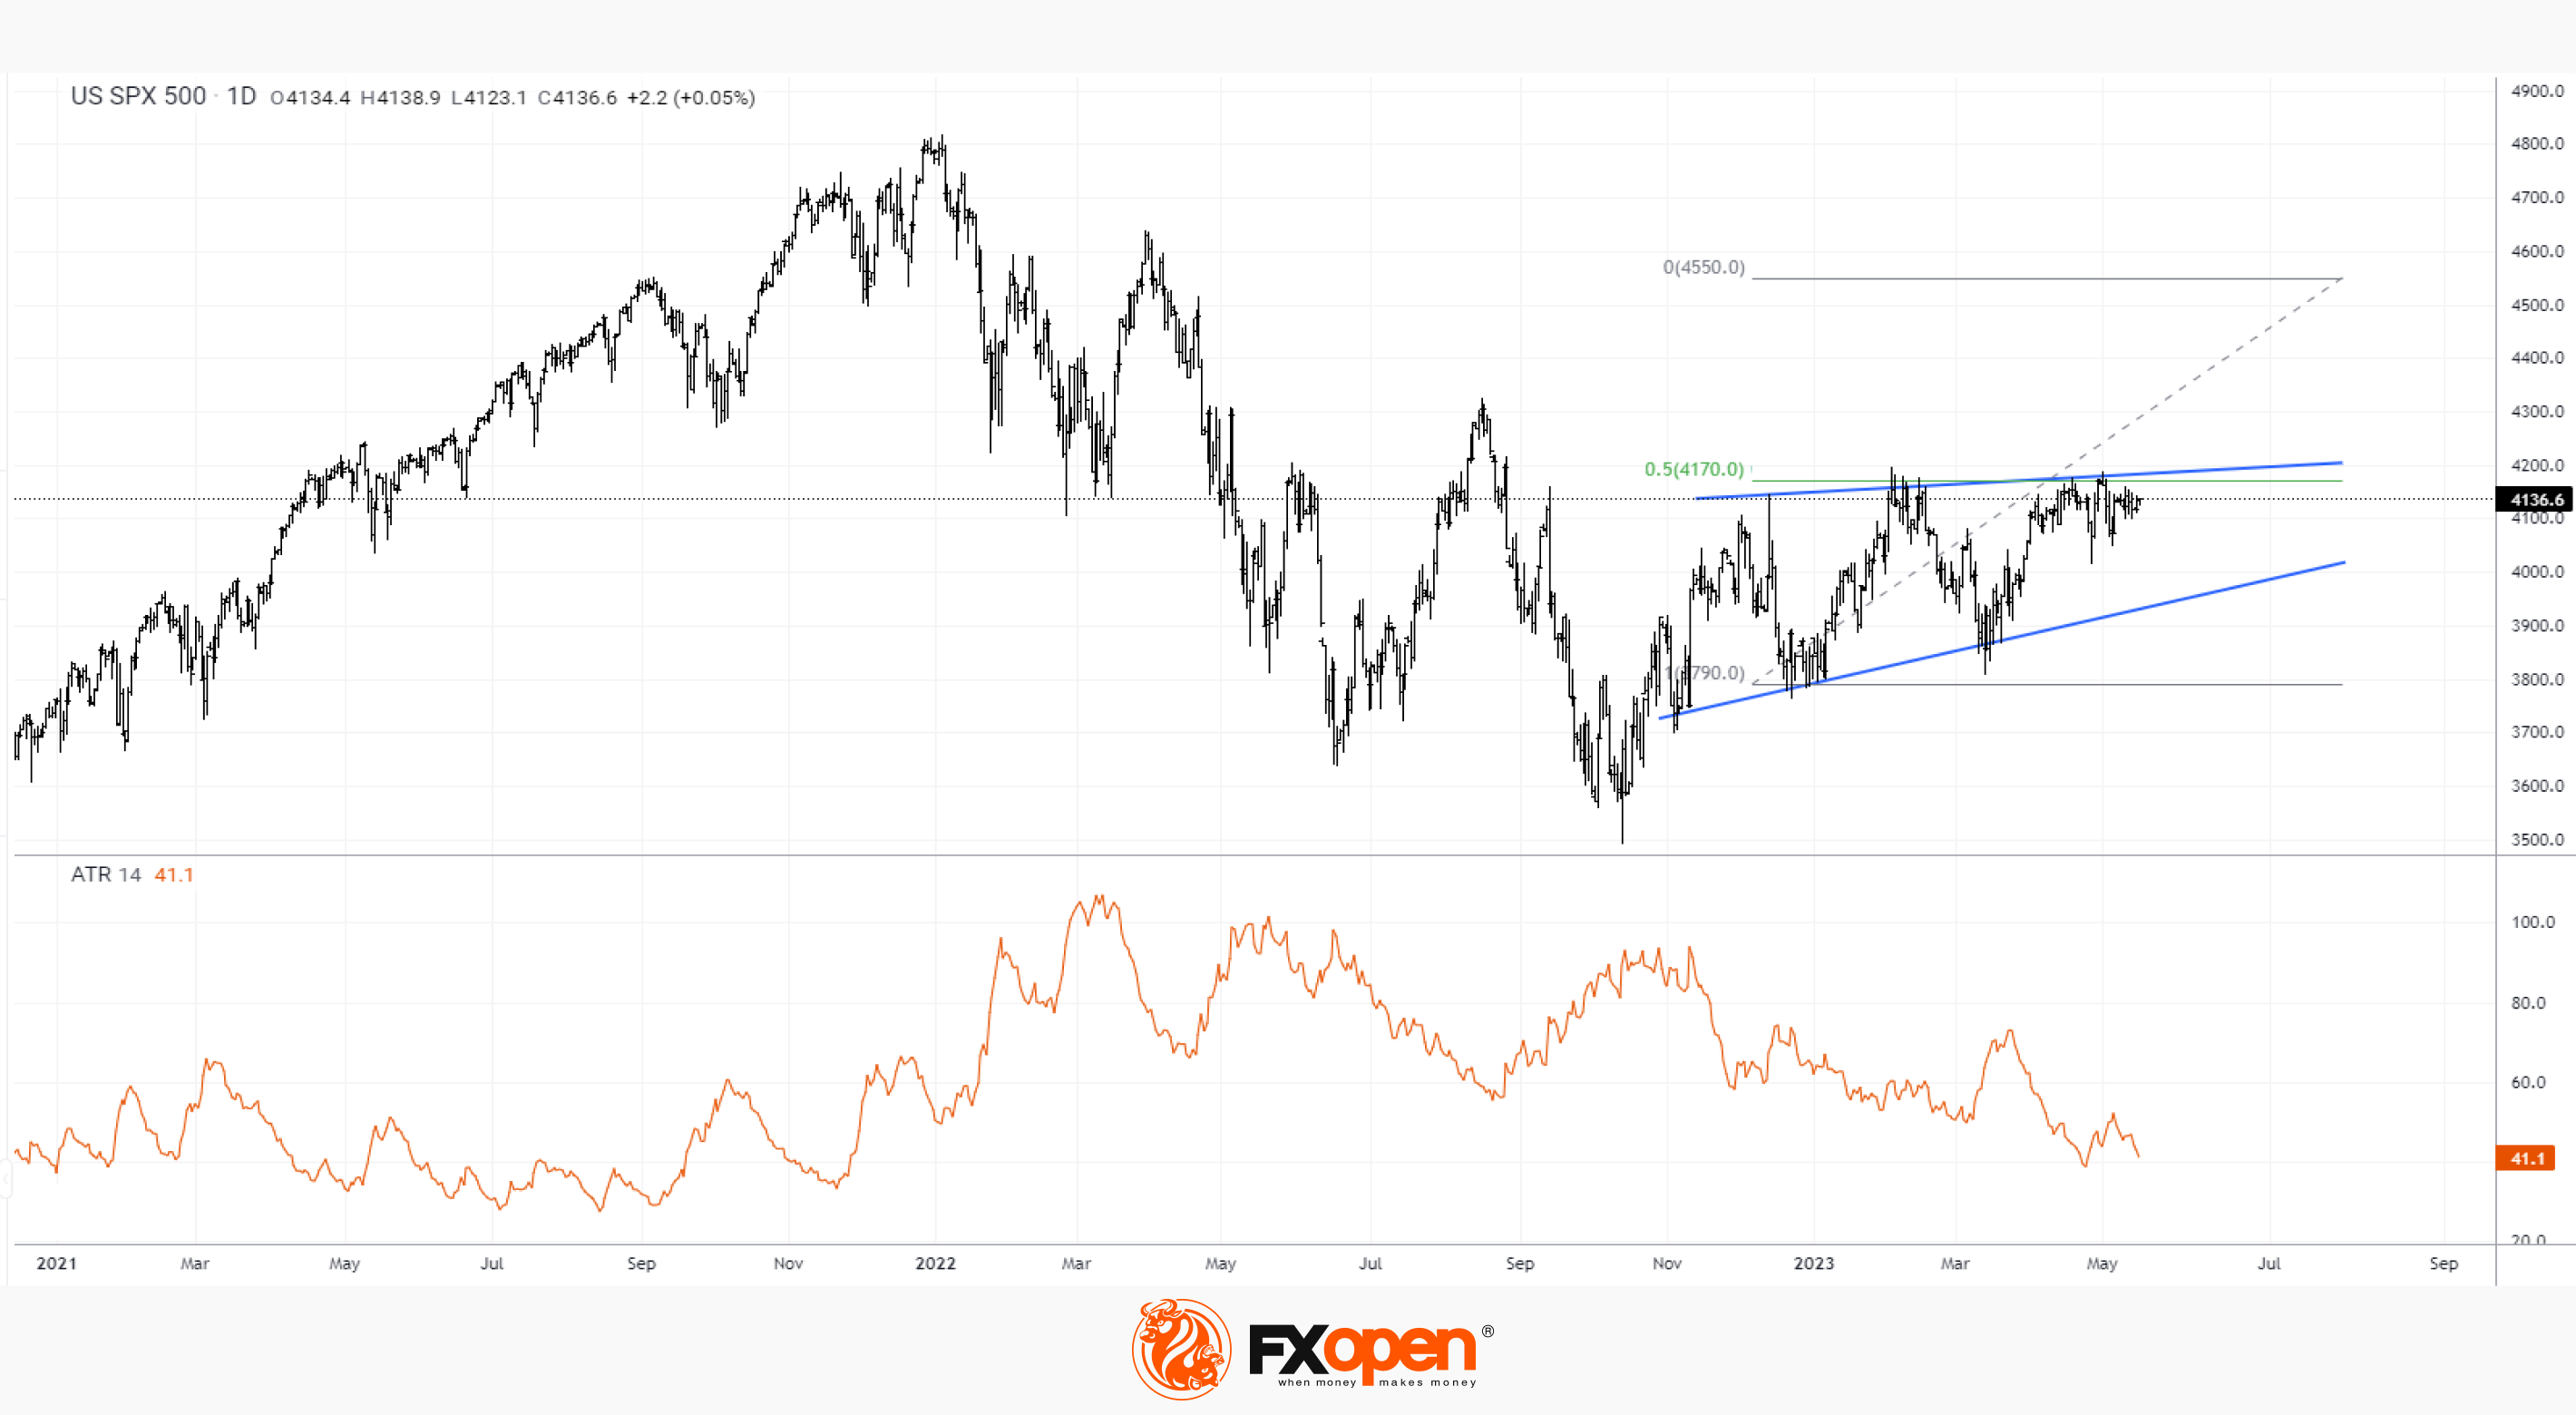
Decreasing volatility forms a narrowing triangle (shown in blue lines). Its breakdown may lead to a trend that will change the price of the E-mini S&P 500 futures to a value approximately equal to the height of this triangle. Let's say in the event of a bullish breakout, the E-mini S&P 500 could rise to 4,550.
This article represents the opinion of the Companies operating under the FXOpen brand only. It is not to be construed as an offer, solicitation, or recommendation with respect to products and services provided by the Companies operating under the FXOpen brand, nor is it to be considered financial advice.
Trade global index CFDs with zero commission and tight spreads (additional fees may apply). Open your FXOpen account now or learn more about trading index CFDs with FXOpen.
This article represents the opinion of the Companies operating under the FXOpen brand only. It is not to be construed as an offer, solicitation, or recommendation with respect to products and services provided by the Companies operating under the FXOpen brand, nor is it to be considered financial advice.
Stay ahead of the market!
Subscribe now to our mailing list and receive the latest market news and insights delivered directly to your inbox.


Latest articles

USD/CAD Rises to a Two-Month High
Today, the USD/CAD currency pair climbed above the 1.3787 level for the first time since late January.
→ Demand for the US dollar is being supported by concerns over escalating tensions in the Middle East. Market participants are favouring

Alphabet (GOOGL) Shares Fall to 2026 Low
As the chart shows, Alphabet (GOOGL) shares have dropped to their lowest level of 2026, with trading closing well below the psychological $300 per share mark.
Why Have Alphabet (GOOGL) Shares Declined?
The bearish move is driven by a combination

FX Market Awaits Macro Data: EUR/USD and GBP/USD Near Range Boundaries
European currencies are trading without a clear direction against the US dollar, remaining in a consolidation phase following the earlier decline driven by USD strength. At the start of the week, both EUR/USD and GBP/USD attempted a recovery,