


EUR/GBP Analysis: Price Reaches 6-month High
FXOpen
In the fall of 2023, bullish sentiment developed in the EUR/GBP market: since September 1, the rate has risen by more than 2%, price dynamics have formed an ascending channel (shown in blue). Moreover, on Friday, the price reached its highest in approximately 6 months.
Growth drivers, among other things, are news related to the policies of the Bank of England and the ECB aimed at combating high inflation, and what signals the economy gives in such conditions.
The latest news about UK GDP turned out to be better than expected (actual = +0.2% for the 3rd quarter, expectations = +0.1%), but the pound sterling did not show a positive reaction, for two reasons from a fundamental point of view:
→ Firstly, the details show that a significant contribution to GDP growth came from imports, a category that tends to be quite volatile between quarters. Other key areas — notably consumption and business investment — posted negative results in the quarter.
→ Secondly, GDP may decline due to the fact that the high rate policy pursued by the Bank of England should be more fully felt in the coming 2024.
If the pound didn't strengthen on Friday on the GDP news, could the bullish trend continue?
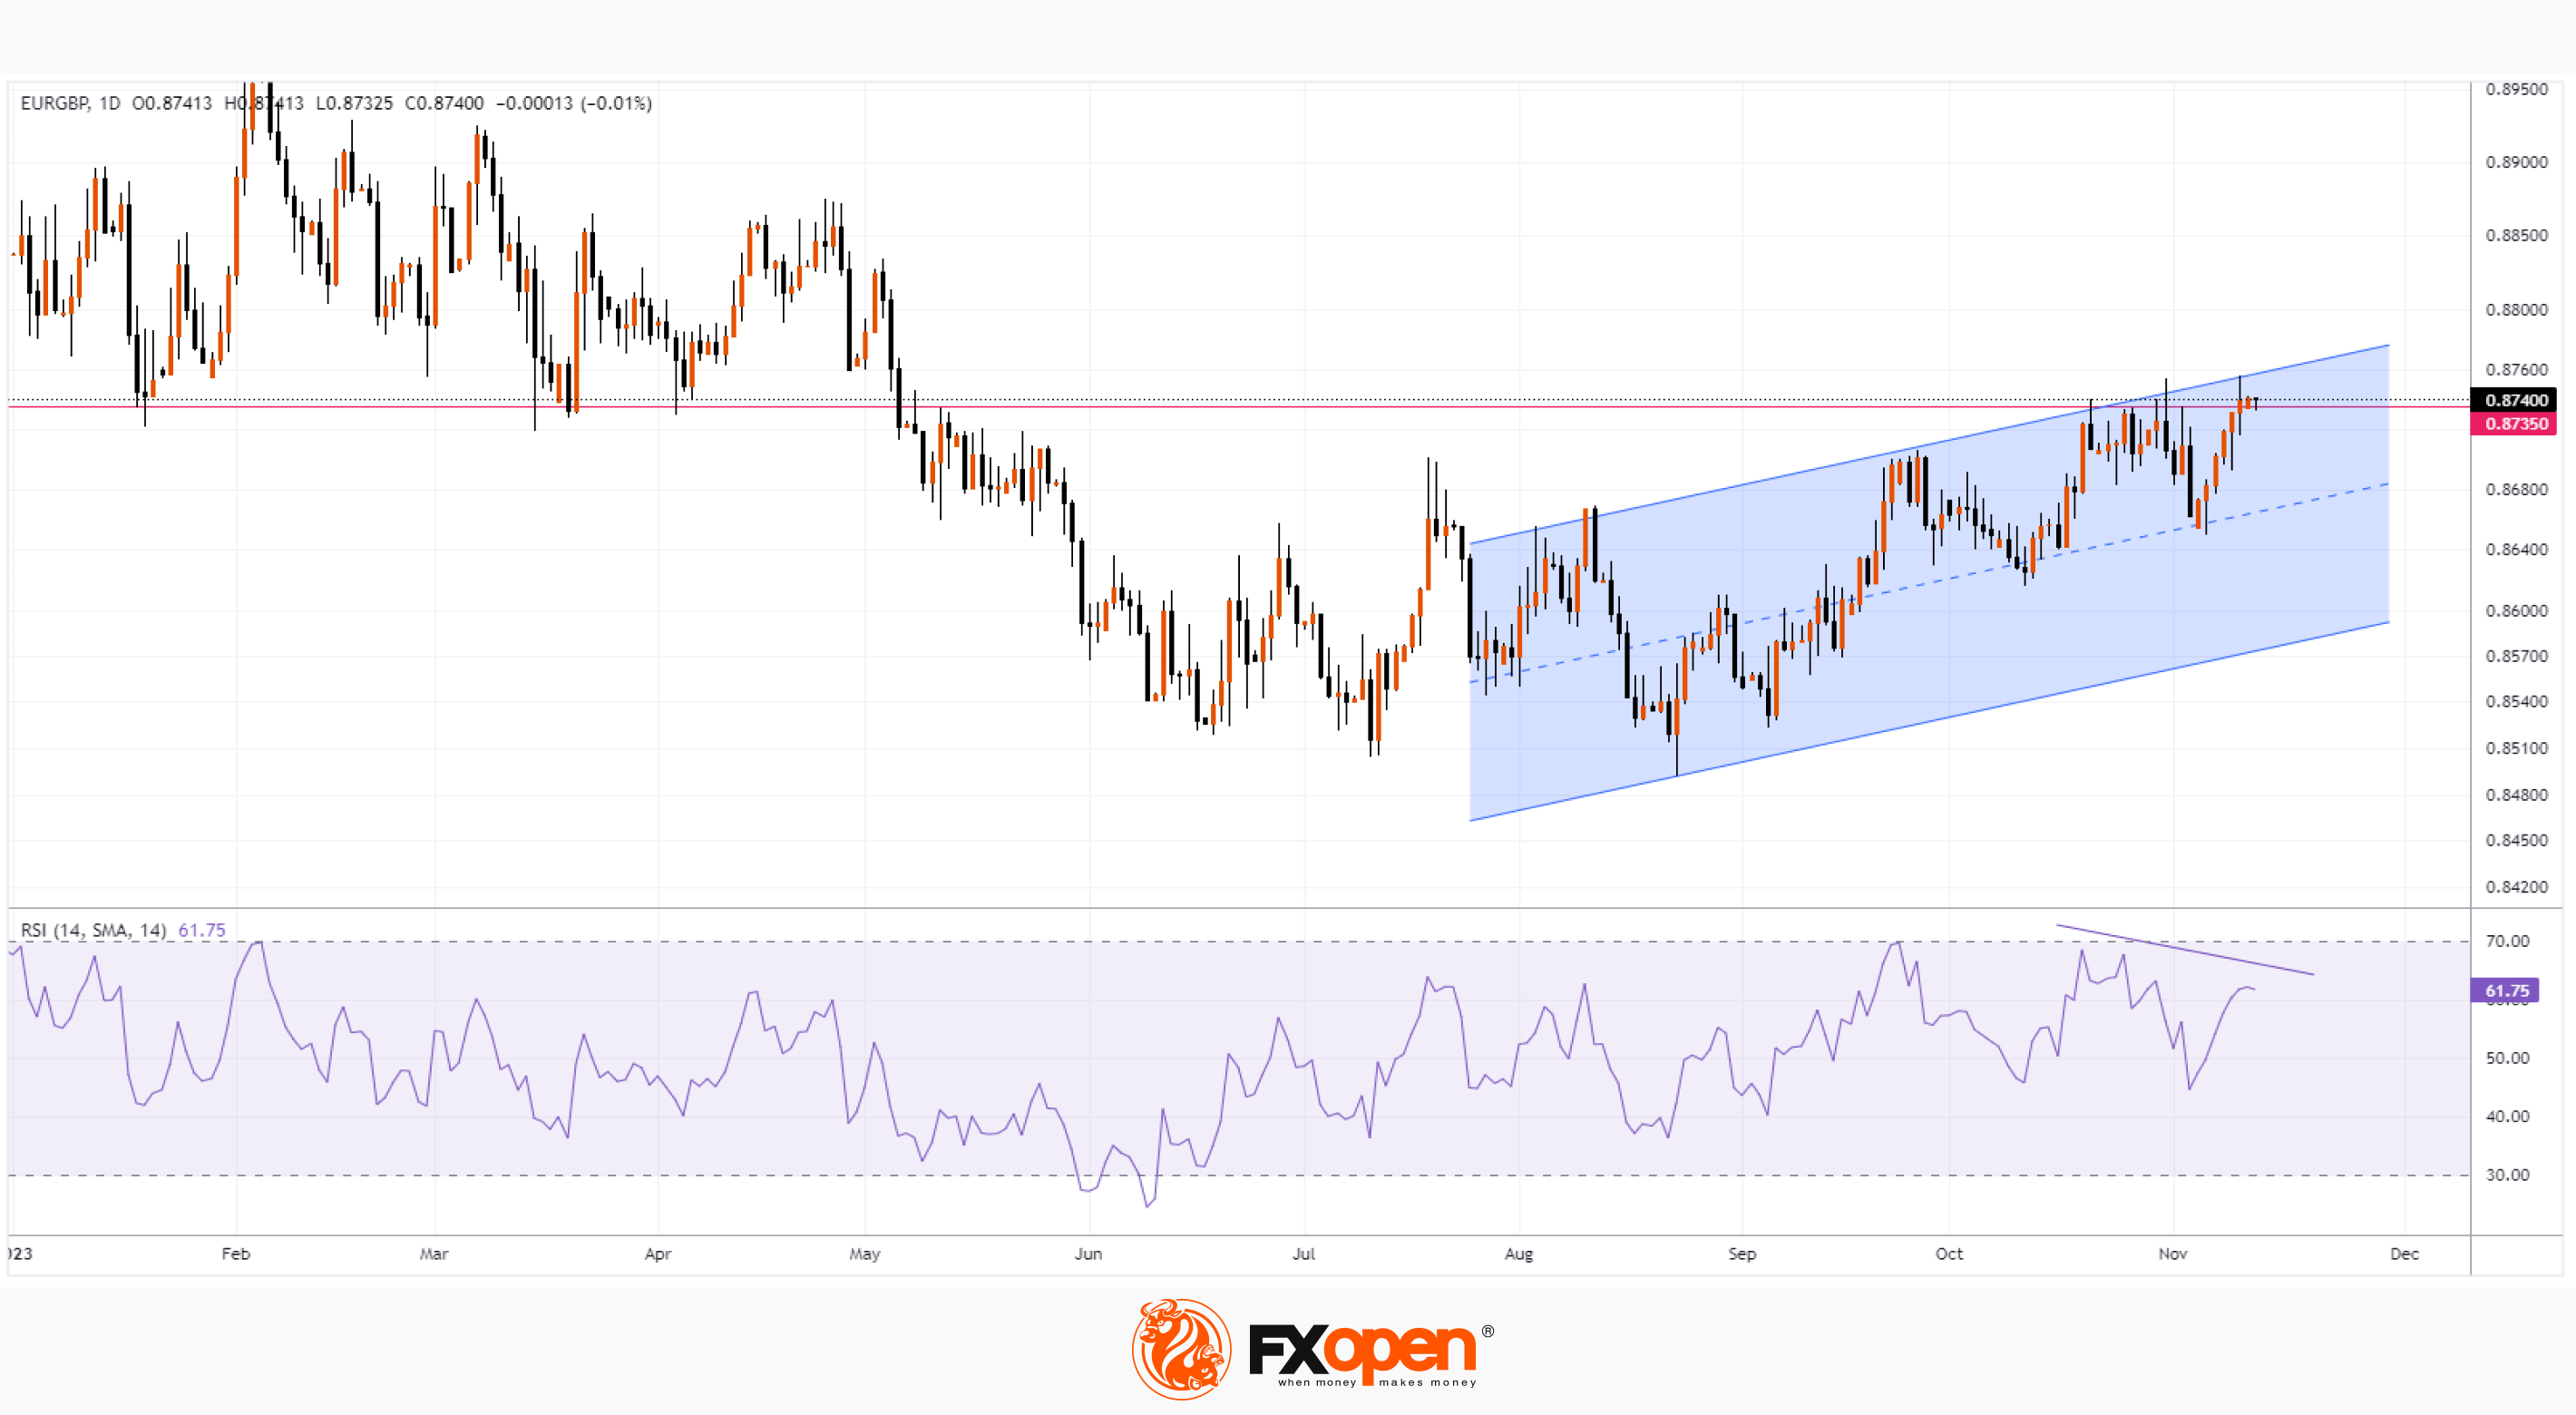
An important factor to note here from a technical analysis point of view is that the EUR/GBP price is near the key resistance of 0.8735. In the past, the level acted as support, holding its course in the first 4 months of the year. Now the level can act as resistance.
→ Divergence on the RSI indicator shows that the bullish momentum is weakening.
→ Resistance from the upper border of the ascending channel has not yet been broken.
These factors indicate that the EUR/GBP rate may be vulnerable to a pullback within the ascending channel.
Trade over 50 forex markets 24 hours a day with FXOpen. Take advantage of low commissions, deep liquidity, and spreads from 0.0 pips (additional fees may apply). Open your FXOpen account now or learn more about trading forex with FXOpen.
This article represents the opinion of the Companies operating under the FXOpen brand only. It is not to be construed as an offer, solicitation, or recommendation with respect to products and services provided by the Companies operating under the FXOpen brand, nor is it to be considered financial advice.
Stay ahead of the market!
Subscribe now to our mailing list and receive the latest market news and insights delivered directly to your inbox.


Latest articles

Dow Jones (DJIA): Consolidation Beyond the Trend
Federal Reserve Chair Kevin Warsh testified before Congress on 14–15 July, reaffirming the Fed's commitment to bringing inflation back to target while providing no clear guidance on the future path of interest rates. Meanwhile, June inflation data came in

European Currencies Strengthen Ahead of Key Macroeconomic Releases
EUR/USD and GBP/USD continue to recover moderately following the recent weakening of the US dollar. European currencies have been supported by expectations that US inflationary pressures will continue to ease after softer-than-expected CPI and PPI data, reinforcing market

Brent Crude Oil: From Ceasefire to Crossfire — What's Next?
Just weeks ago, traders were pricing in peace. Now they're pricing in war again—and that reversal says everything about how fragile the current Middle East calm really is.
Brent crude has surged to $86 a barrel, its highest level