FXOpen

The current high growth rate, which was last seen in November 2022, was the result of decisions by central banks:
→ on Wednesday, the US Federal Reserve kept the interest rate at 5.25%;
→ and on Thursday, the ECB raised the rate from 3.75% to 4%. Eurozone inflation will remain "too high for too long," Lagarde said. The possibility of a rate hike in July is "very likely".
If the Fed started to apply the tightening policy earlier and came to a pause in a series of rate hikes faster, in turn the ECB is taking similar actions, but with some lag in time.

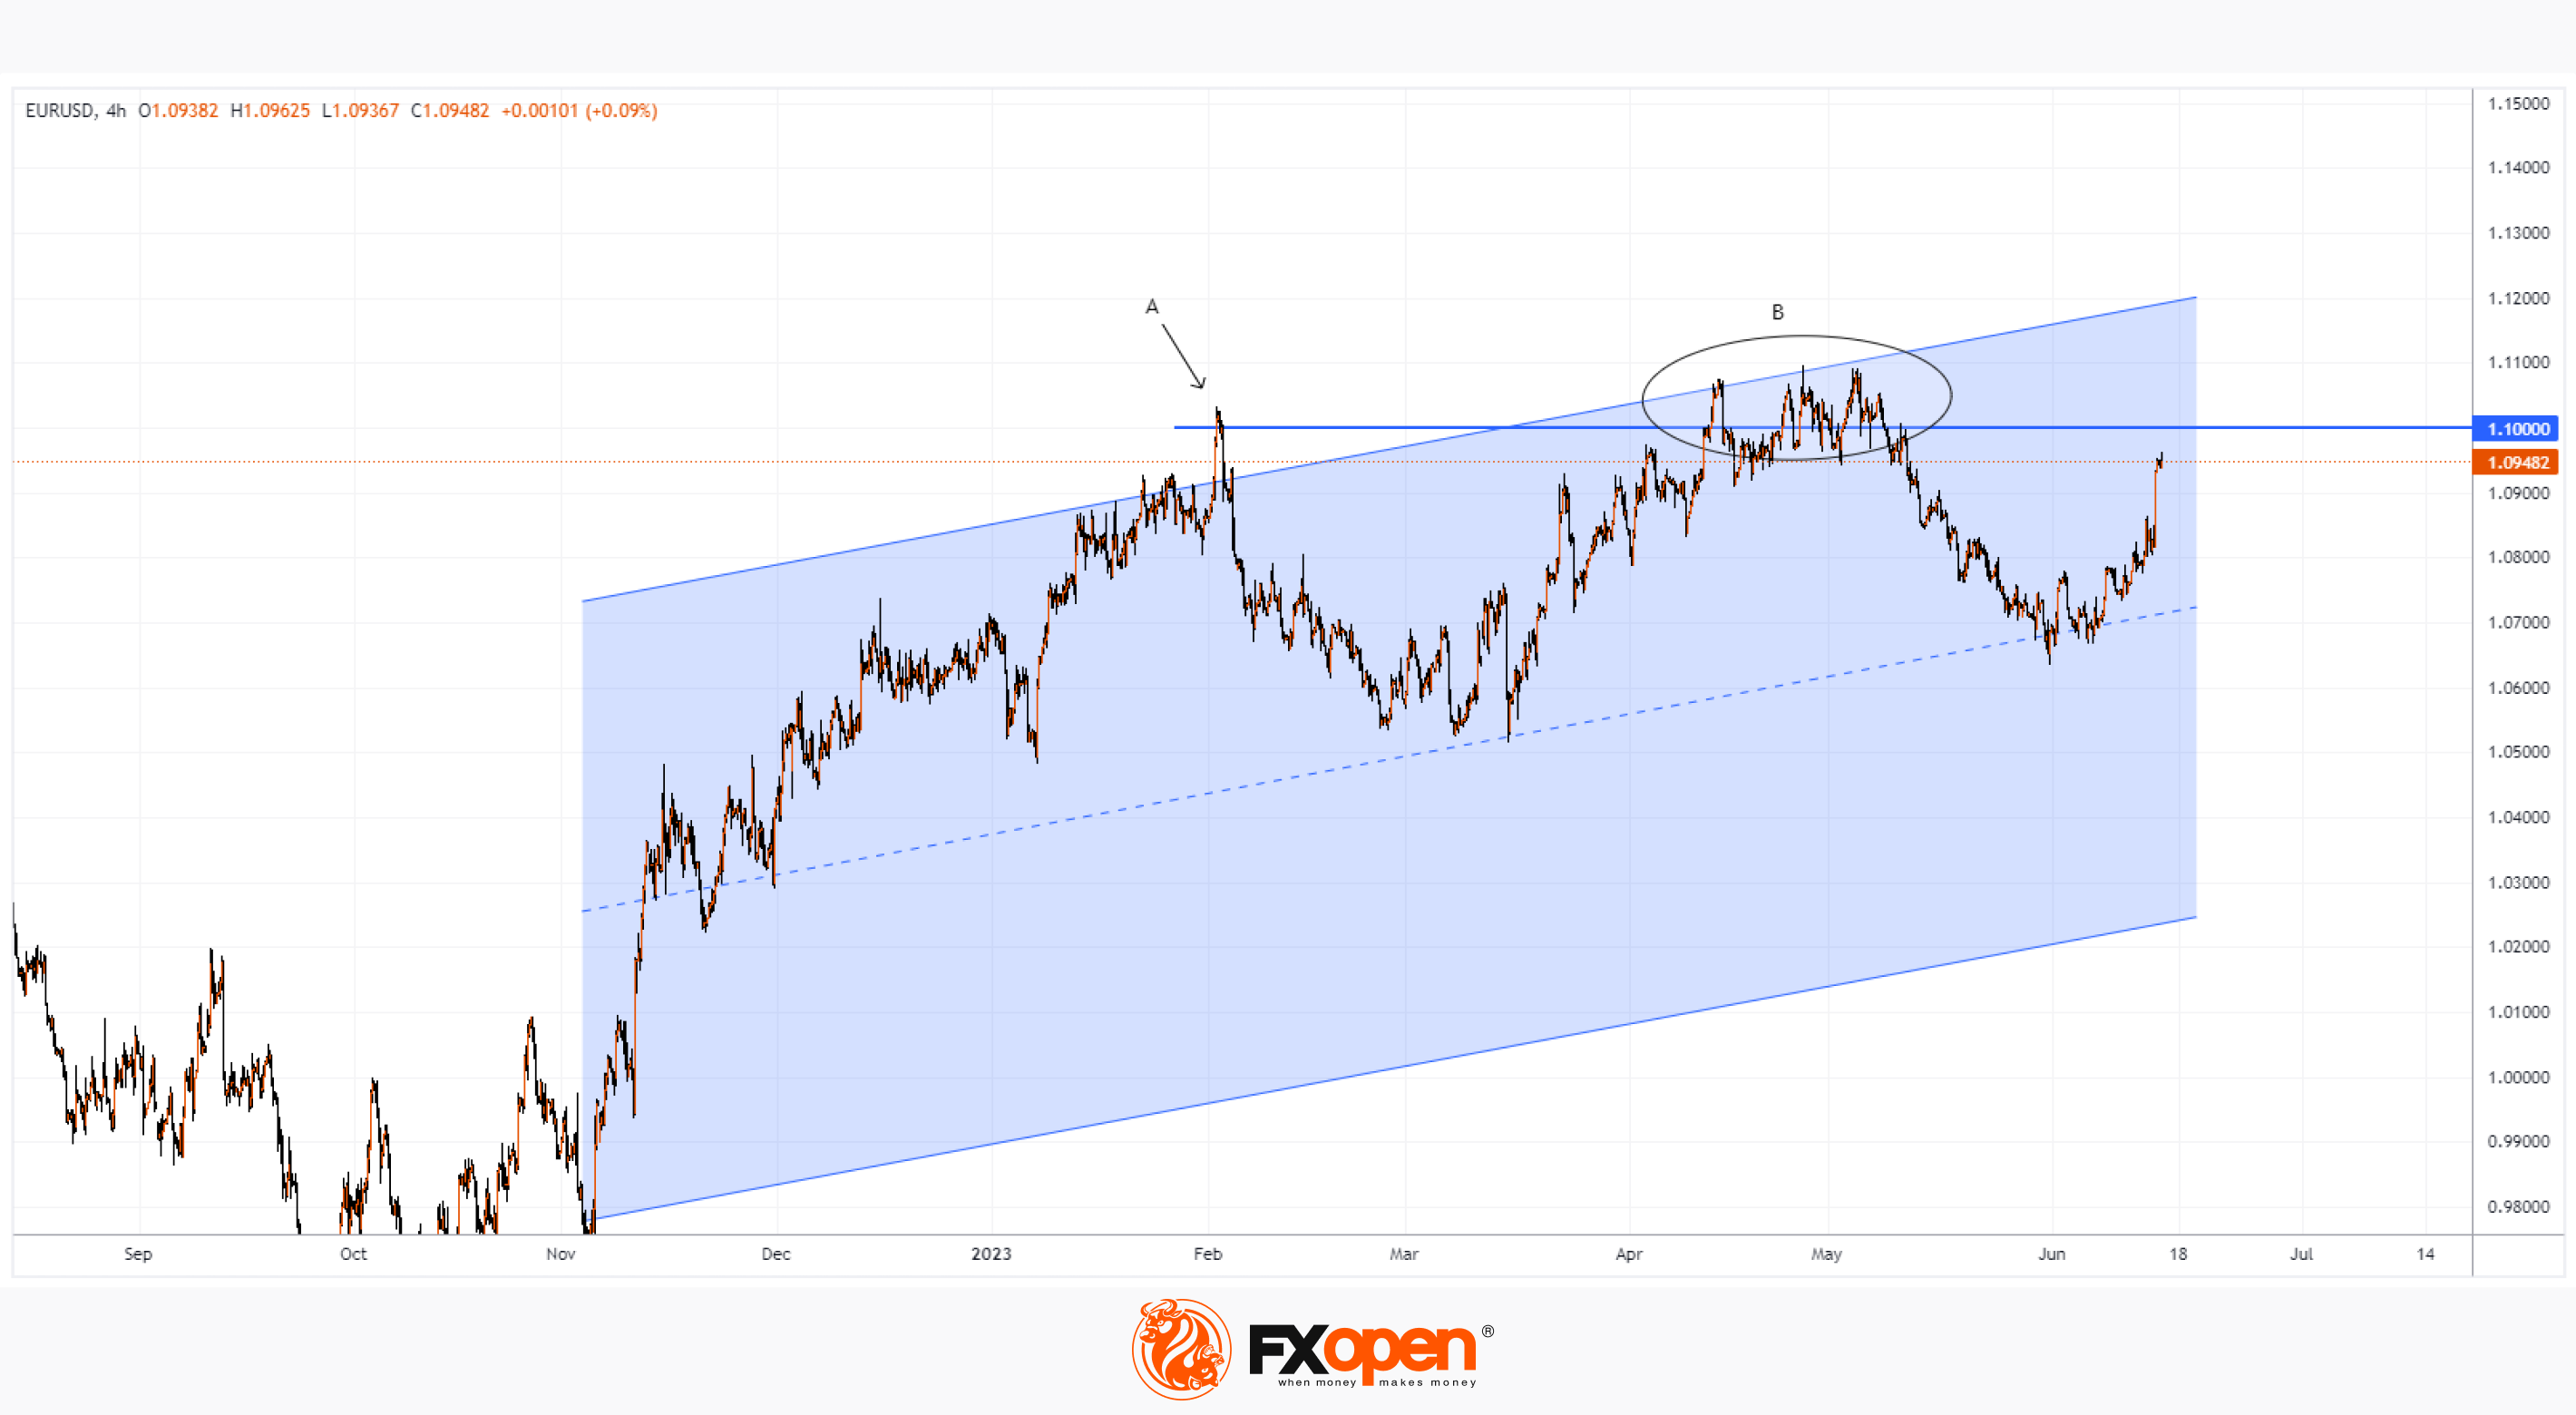
On Friday morning, the EUR/USD rate reached 1.096. The EUR/USD chart shows that:
→ price dynamics continues to develop an upward channel (shown in blue);
→ the EUR/USD rate is approaching the psychological mark of 1.1. If in February the bulls suffered a quick setback (A), and in April-May they managed to linger (B) around this mark, then the continuation of the current momentum can lead to a successful bullish breakout and fixing the rate above 1.1.
Trade over 50 forex markets 24 hours a day with FXOpen. Take advantage of low commissions, deep liquidity, and spreads from 0.0 pips. Open your FXOpen account now or learn more about trading forex with FXOpen.
This article represents the opinion of the Companies operating under the FXOpen brand only. It is not to be construed as an offer, solicitation, or recommendation with respect to products and services provided by the Companies operating under the FXOpen brand, nor is it to be considered financial advice.
Stay ahead of the market!
Subscribe now to our mailing list and receive the latest market news and insights delivered directly to your inbox.


