


FXOpen
Last week, the European Central Bank (ECB) cut interest rates as expected, marking the third reduction this year. According to Trading Economics, market participants speculate there could be another rate cut in December. This dovish stance is weakening the euro, as the ECB signals deteriorating economic prospects in the Eurozone.
In contrast, the U.S. dollar remains strong, supported by:
→ Robust economic data, including retail sales figures that exceeded expectations last week.
→ Expectations that Trump may win the next U.S. election, with his proposed trade and tax policies likely to support the dollar.
As a result, EUR/USD continued its decline last week, with the pair falling by about 2.5% since the start of October. Will the downtrend persist?
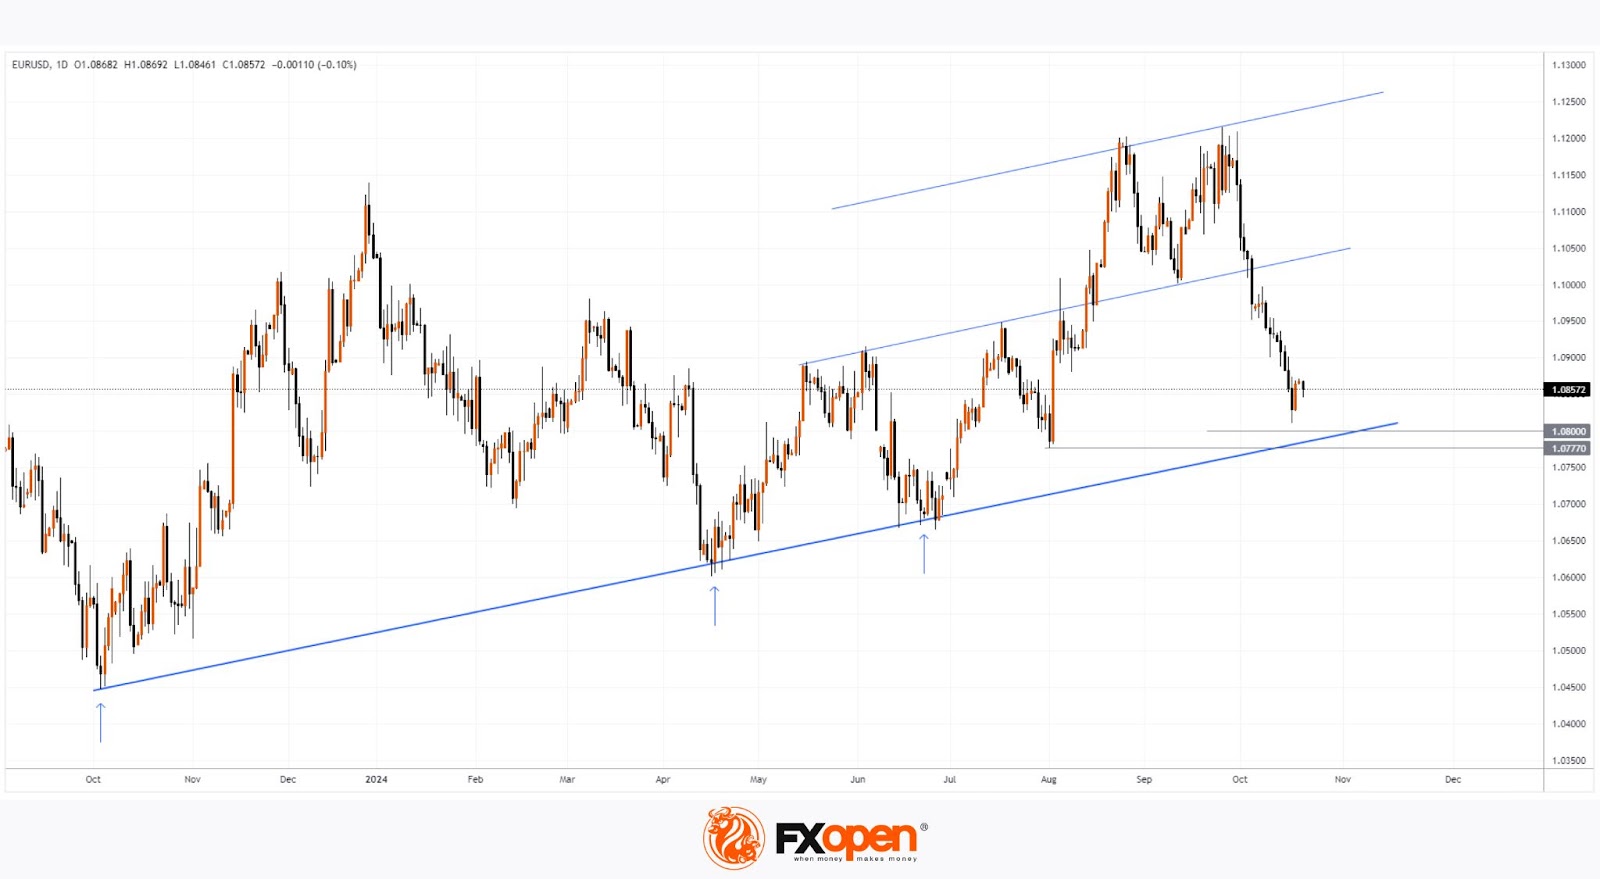
Today's technical analysis of the EUR/USD daily chart shows that the pair is approaching a key support line (marked in blue), connecting significant lows from 2023-2024 (highlighted by arrows).
Additional support may come from:
→ The psychological level of 1.0800;
→ A previous significant low near 1.0777.
Thus, the EUR/USD area formed by these lines could present challenges to the developing bearish trend.
Trade over 50 forex markets 24 hours a day with FXOpen. Take advantage of low commissions, deep liquidity, and spreads from 0.0 pips (additional fees may apply). Open your FXOpen account now or learn more about trading forex with FXOpen.
This article represents the opinion of the Companies operating under the FXOpen brand only. It is not to be construed as an offer, solicitation, or recommendation with respect to products and services provided by the Companies operating under the FXOpen brand, nor is it to be considered financial advice.
Stay ahead of the market!
Subscribe now to our mailing list and receive the latest market news and insights delivered directly to your inbox.


Latest articles

Market Analysis: GBP/USD Dips Further As EUR/GBP Regains Traction
GBP/USD failed to climb above 1.3500 and corrected some gains. EUR/GBP started a decent increase and might aim for more gains above 0.8700.
Important Takeaways for GBP/USD and EUR/GBP Analysis Today
· The British Pound


Market Insights with Gary Thomson: Oil, US Retail Sales & NFP in Focus
In this video, we’ll explore the key economic events and market trends, shaping the financial landscape. Get ready for insights into financial markets to help you navigate the week ahead. Let’s dive in!
In this episode of Market