


FXOpen

On 10 March, analysing the EUR/USD chart, we:
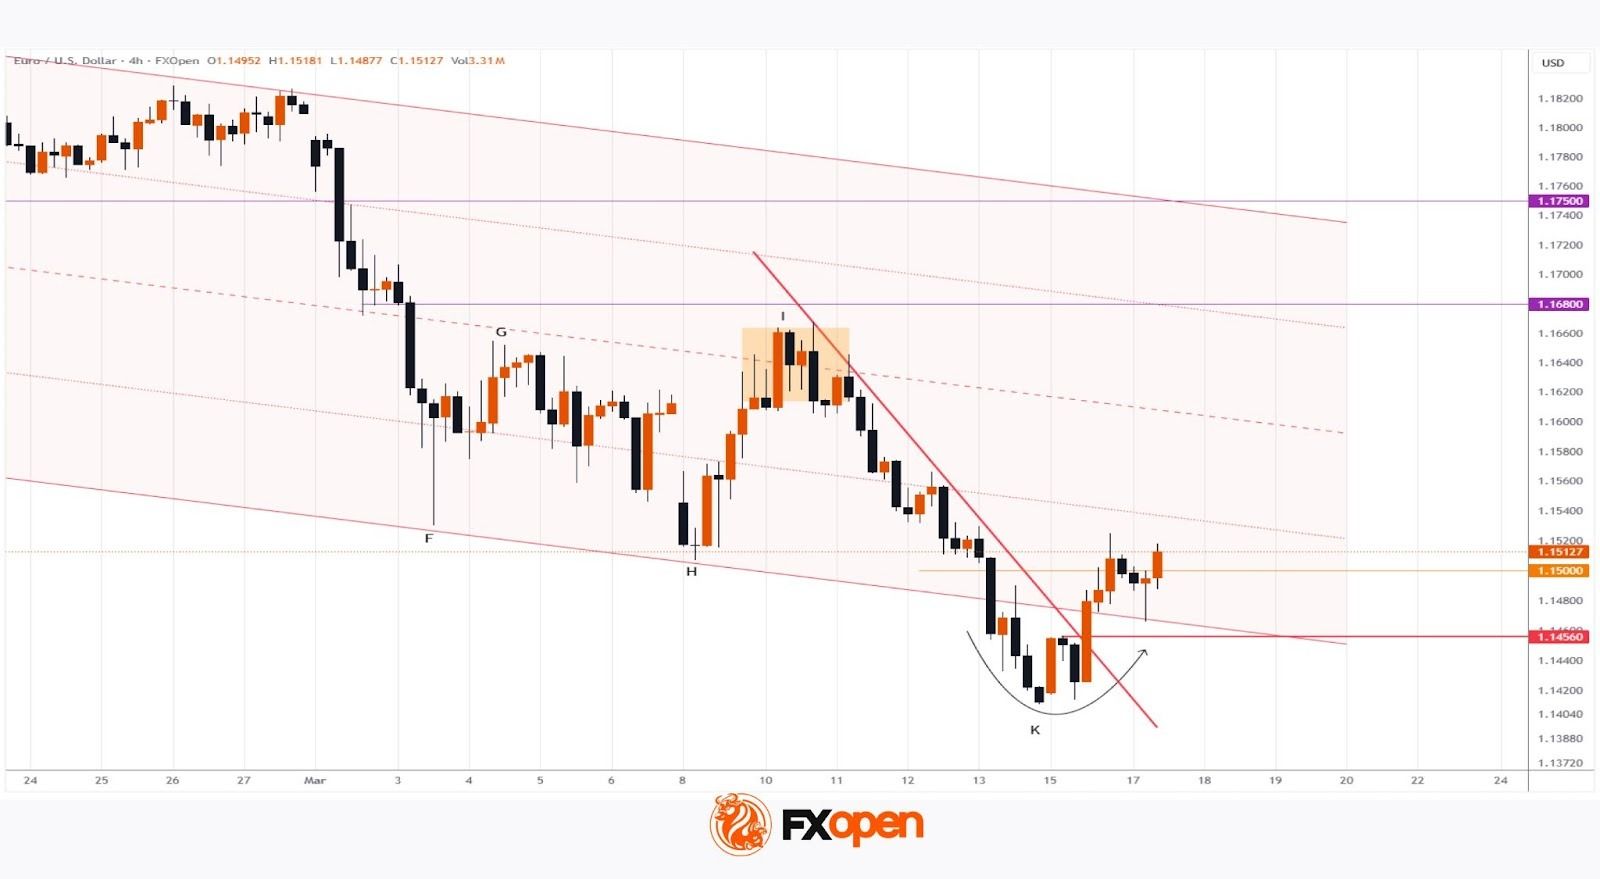
→ considered the long-term descending channel, which remains relevant;
→ noted that the sequence of lower lows A–H was broken with the appearance of a higher peak I, with 1.1680 potentially acting as resistance.
At peak I, bulls exhausted their strength: after forming a consolidation zone near the channel’s median, bears regained control and pushed the price to a new yearly low, driven by a bearish fundamental backdrop.
Tomorrow, the Fed is expected to release its interest rate decision, while the ECB will issue comments the day after. These events could significantly shift market sentiment regarding EUR/USD, and current price behaviour suggests that bulls may attempt a comeback.
Technical Analysis of EUR/USD
Note the following:
→ The descending trendline from last week has been breached; the market is holding above the breakout level around 1.14560.
→ The pair is recovering from oversold territory just below the lower boundary of the channel. The psychological level 1.1500 may provide support.
Thus, traders should consider the scenario in which EUR/USD’s strong movement on Monday–Tuesday is confirmed by upcoming central bank news.
Trade over 50 forex markets 24 hours a day with FXOpen. Take advantage of low commissions, deep liquidity, and spreads from 0.0 pips (additional fees may apply). Open your FXOpen account now or learn more about trading forex with FXOpen.
This article represents the opinion of the Companies operating under the FXOpen brand only. It is not to be construed as an offer, solicitation, or recommendation with respect to products and services provided by the Companies operating under the FXOpen brand, nor is it to be considered financial advice.
Stay ahead of the market!
Subscribe now to our mailing list and receive the latest market news and insights delivered directly to your inbox.


Latest articles

Market Analysis: Gold Price Slips Back, WTI Crude Oil Rally Gains Fresh Strength
Gold price rallied above $4,750 before correcting lower. Crude oil prices are rising and could climb further higher toward $110.00.
Important Takeaways for Gold and WTI Crude Oil Prices Analysis Today
· Gold price gained pace for a move

Consolidation Ahead of NFP: Commodity Currencies Search for Direction
Commodity-linked currencies have entered a consolidation phase following recent directional moves, as market participants adopt a wait-and-see approach ahead of key US labour market data. Current price action reflects a balance between ongoing demand for the US dollar and attempts

The Real Driver Behind the Dollar Rally: Market Insights with Gary Thomson
The US dollar has been firm, but the drivers behind the move may be more complex than they first appear.
While geopolitical tension and shifts in risk sentiment play a role, current price behaviour seems increasingly influenced by inflation expectations