


Market Analysis: Gold Price Slips Back, WTI Crude Oil Rally Gains Fresh Strength
FXOpen

Gold price rallied above $4,750 before correcting lower. Crude oil prices are rising and could climb further higher toward $110.00.
Important Takeaways for Gold and WTI Crude Oil Prices Analysis Today
· Gold price gained pace for a move toward $4,800 and recently corrected lower against the US Dollar.
· A key bullish trend line is forming with support at $4,630 on the hourly chart of gold at FXOpen.
· WTI Crude oil prices are moving higher above the $100.00 resistance zone.
· There was a break above a bearish trend line with resistance at $97.00 on the hourly chart of XTI/USD at FXOpen.
Gold Price Technical Analysis
On the hourly chart of Gold at FXOpen, the price was able to climb above $4,500. The price even surpassed $4,750 before the bears appeared.
The price traded close to $4,800 before there was a downside correction. There was a move below $4,750 and $4,700. The price settled below the 50-hour simple moving average, and RSI dipped below 50. There was a move below the 38.2% Fib retracement level of the upward move from the $4,351 swing low to the $4,800 high.
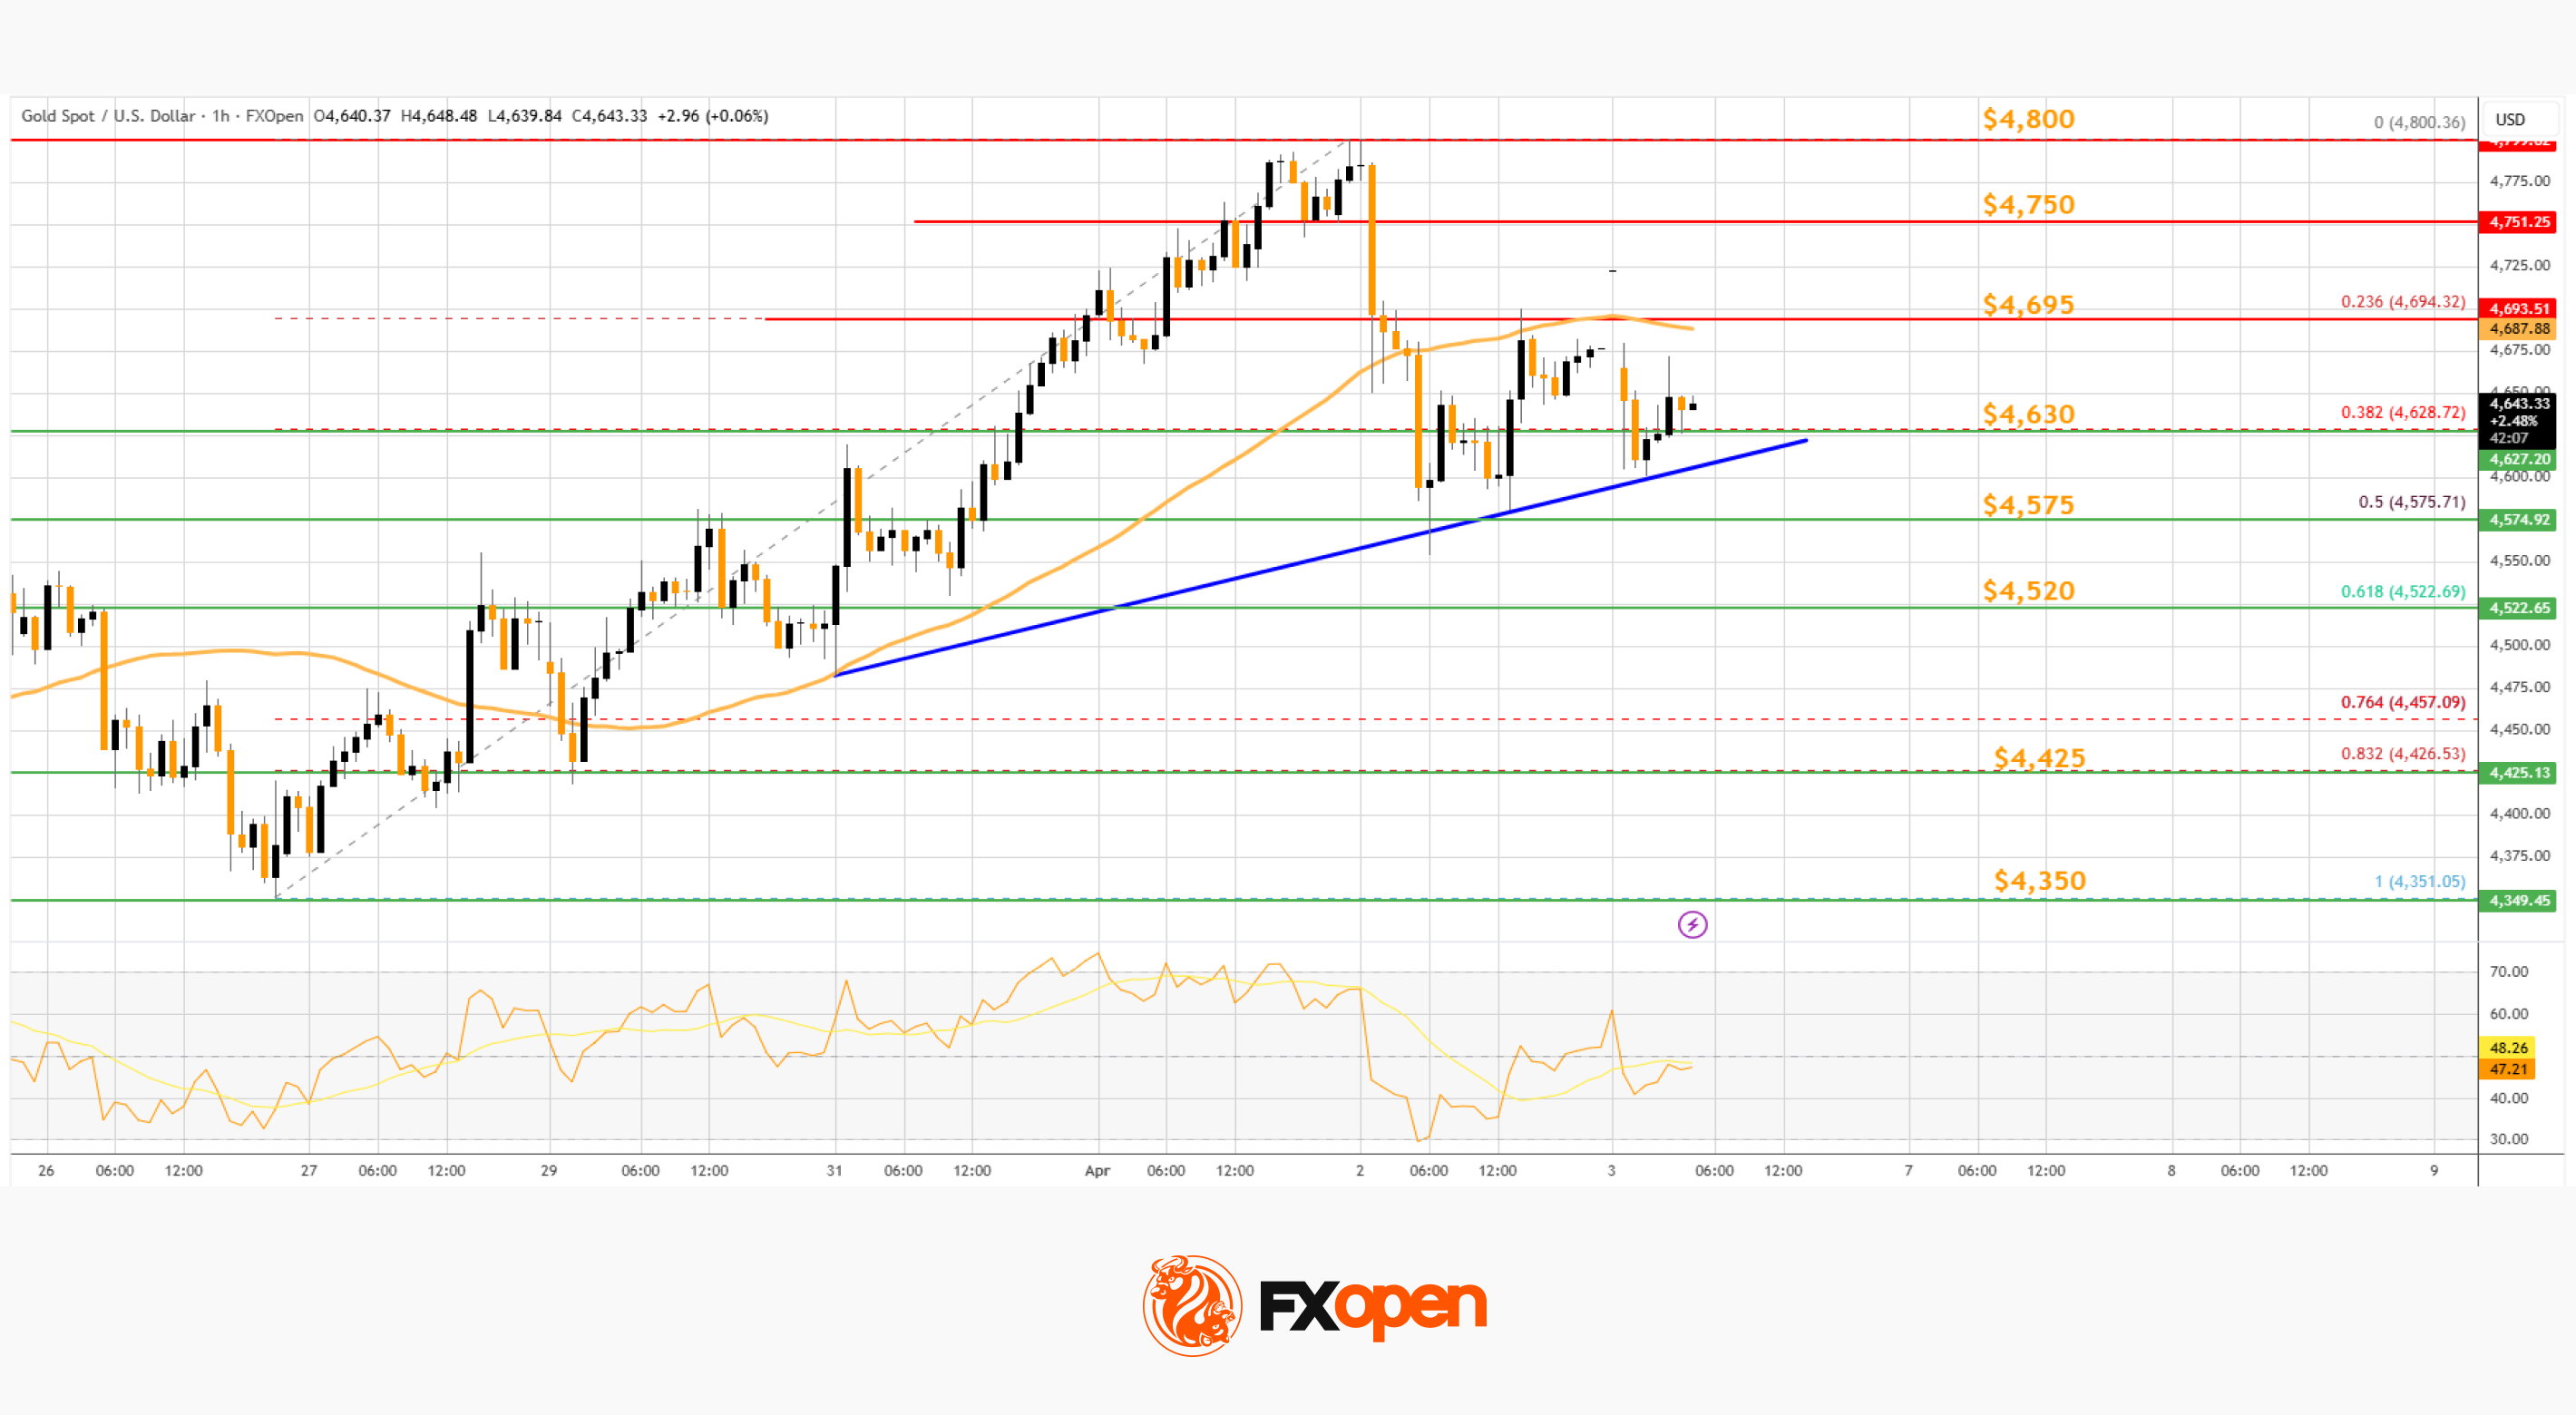
However, the bulls are active above $4,575 and the 50% Fib retracement. There is also a key bullish trend line forming with support at $4,630.
Immediate hurdle on the upside is $4,695 and the 50-hour simple moving average. The next major breakout level is $4,750. An upside break above $4,750 could send Gold price toward $4,800. Any more gains may perhaps set the pace for an increase toward $4,880.
If there is no fresh increase, the price could continue to move down. Initial support on the downside is near $4,630 and the trend line. The first key breakdown zone could be $4,520. If there is a downside break below $4,520, the price might decline further. In the stated case, the price might drop to $4,350.
WTI Crude Oil Price Technical Analysis
On the hourly chart of WTI Crude Oil at FXOpen, the price started a steady increase against the US Dollar. The price gained bullish momentum after it settled above $96.40.
The bulls pushed the price above the 50-hour simple moving average, and the RSI climbed toward 75. Besides, there was a break above a bearish trend line with resistance at $97.00. The price tested the $105.85 zone and is currently consolidating gains.
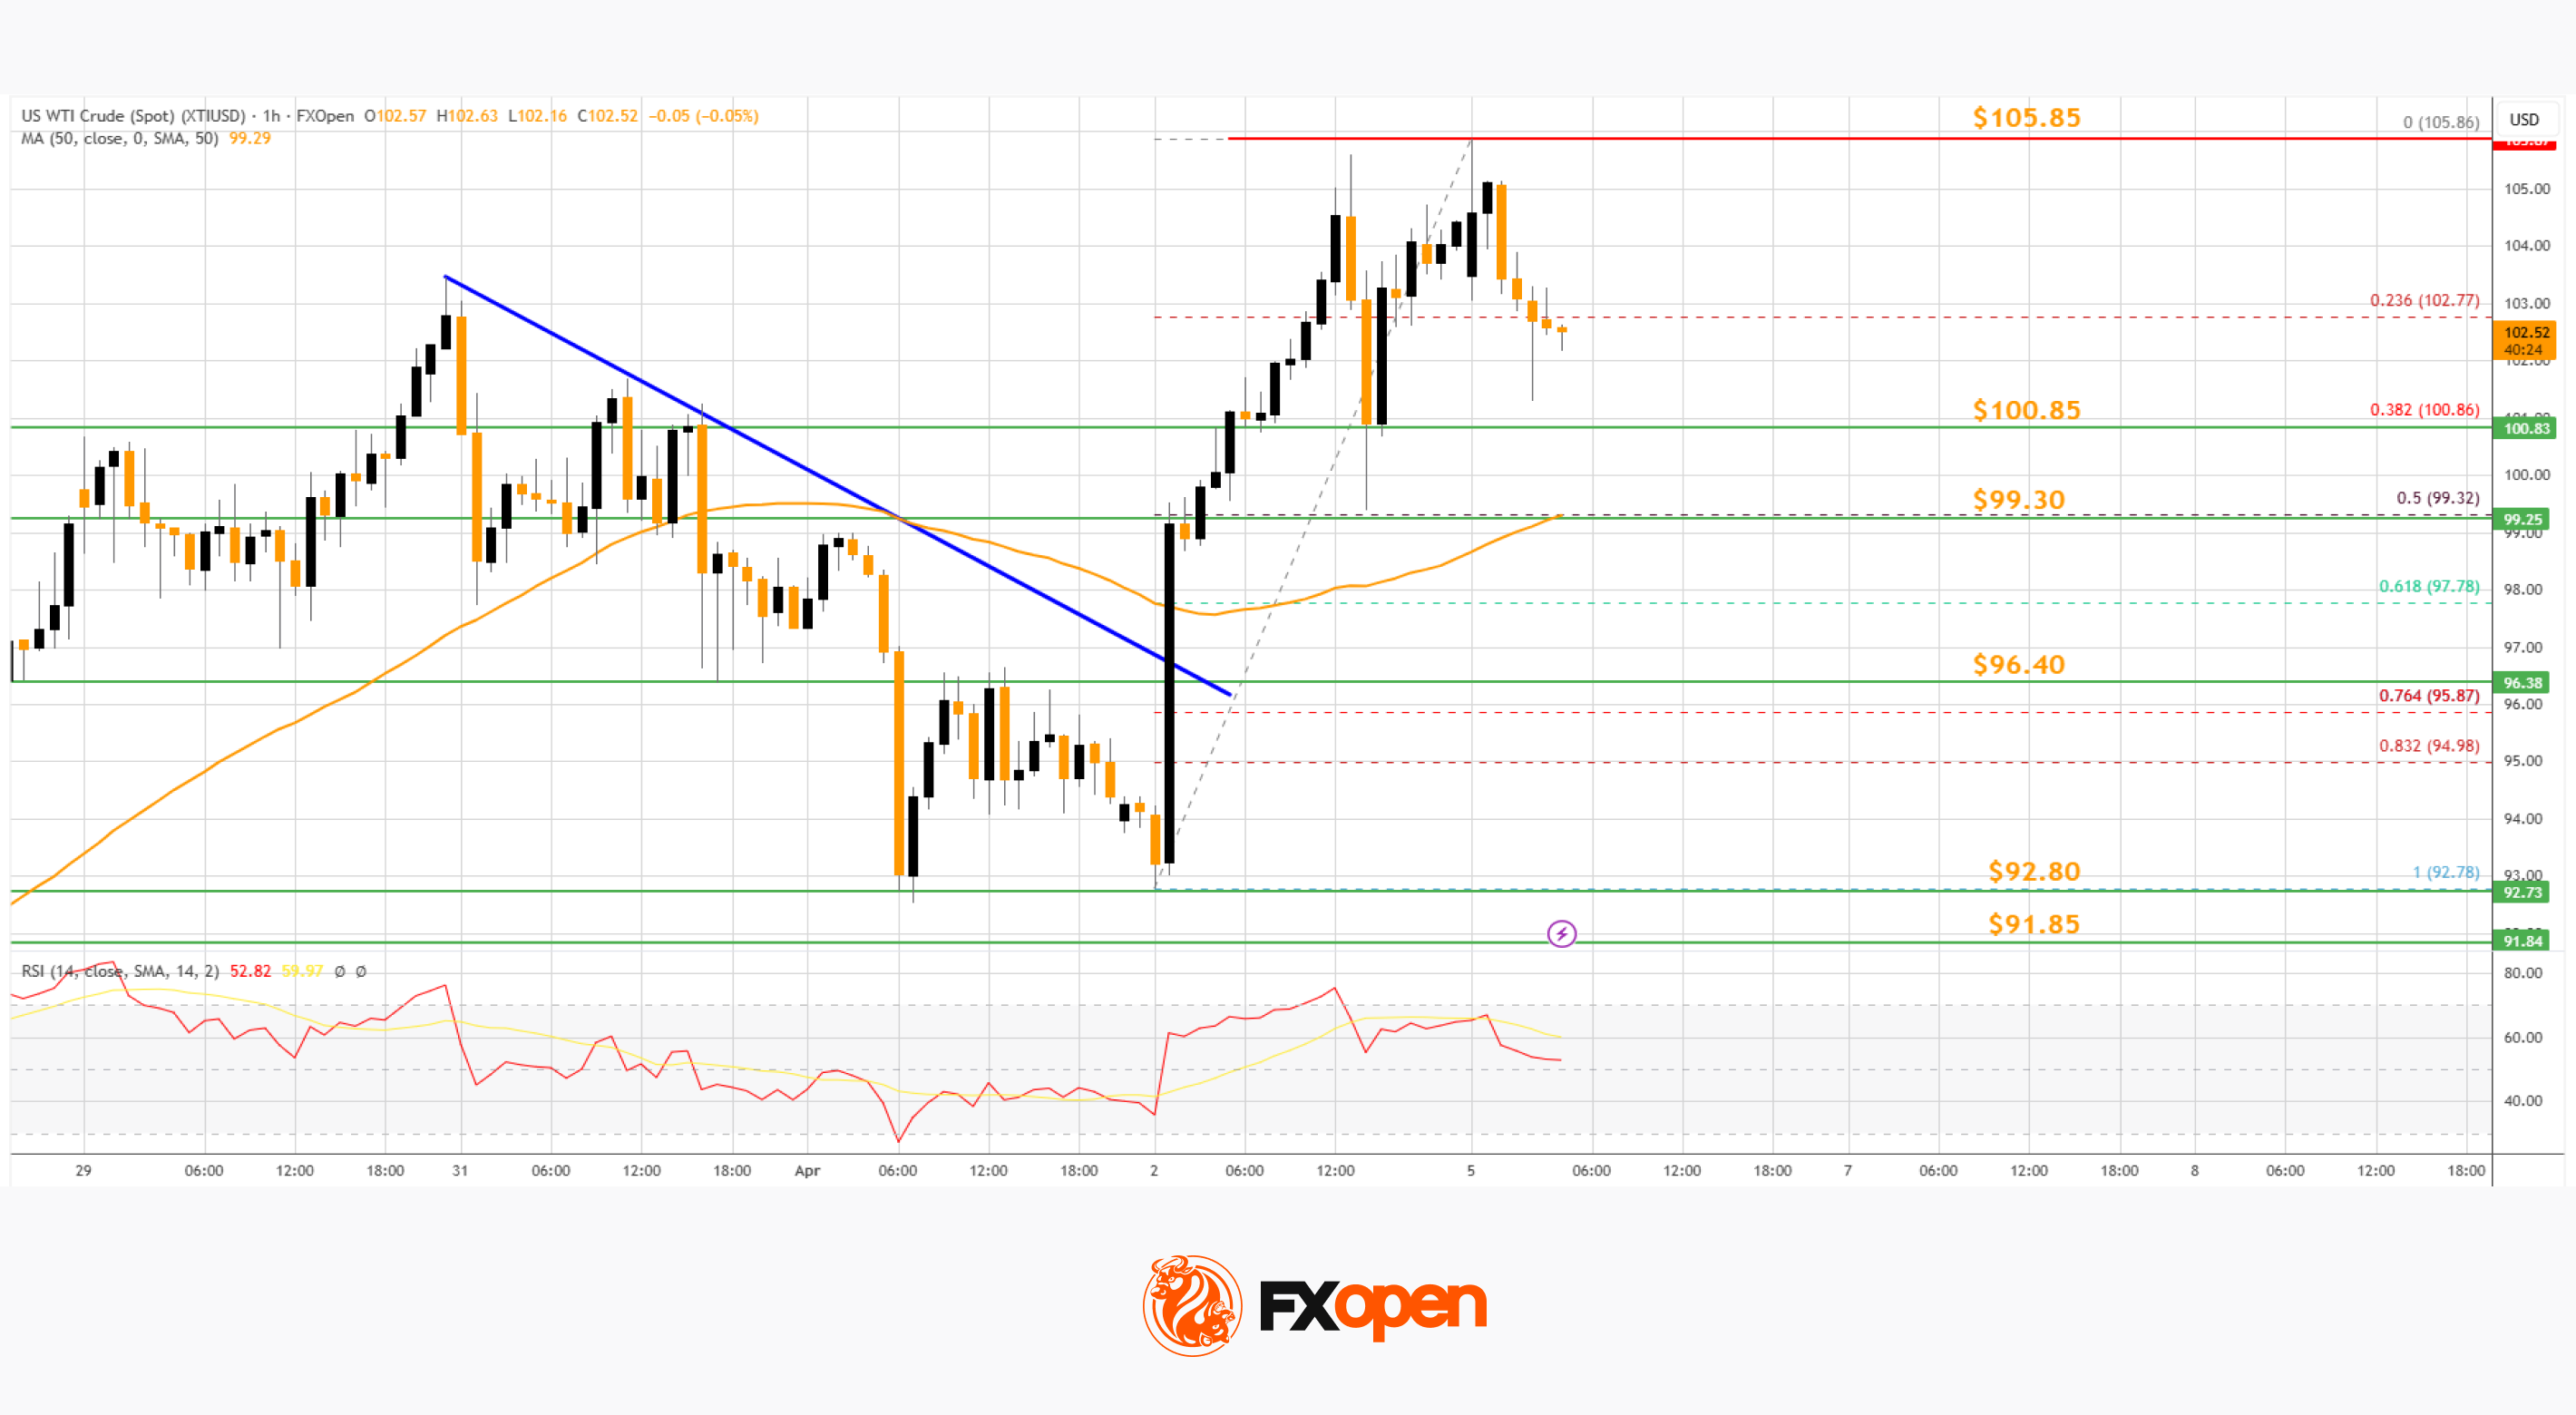
There was a minor pullback below $103 and the 23.6% Fib retracement level of the upward move from the $92.78 swing low to the $105.86 low.
If there is a fresh increase, the price could struggle near $105.85. A close above $106.85 could send the price toward $108. The next key area of interest might be $110. Any more gains might send the price toward $112.
Conversely, the price might correct gains and test $100.85. The main bid area on the WTI crude oil chart could be $99.30, the 50% Fib retracement level, and the 50-hour simple moving average. If there is a downside break, the price might decline toward $96.40. Any more losses may perhaps open the doors for a move to $92.80.
Start trading commodity CFDs with tight spreads (additional fees may apply). Open your trading account now or learn more about trading commodity CFDs with FXOpen.
This article represents the opinion of the Companies operating under the FXOpen brand only. It is not to be construed as an offer, solicitation, or recommendation with respect to products and services provided by the Companies operating under the FXOpen brand, nor is it to be considered financial advice.
Stay ahead of the market!
Subscribe now to our mailing list and receive the latest market news and insights delivered directly to your inbox.


Latest articles

Nasdaq 100: Is This the Correction Traders Have Been Waiting For?
The Nasdaq 100 (US Tech 100 Mini on FXOpen) remains caught between two opposing forces: cooling inflation on one side, and persistent geopolitical instability on the other. On 14 July, June's CPI print came in softer than expected, easing near-term

XRP/USD: Symmetrical Triangle Forms as Trading Volume Fades
On 6 July, Ripple received a full Crypto-Asset Service Provider (CASP) licence under the Markets in Crypto-Assets (MiCA) regulation from Luxembourg's financial regulator, the CSSF. The approval allows the company to offer regulated crypto payment services across all 30 countries

AI Valuations Are Back in the Spotlight
Artificial intelligence remains the dominant investment theme of 2026, but investors are increasingly questioning whether AI stock valuations are keeping pace with reality.
💰 Big Tech continues to invest at an unprecedented scale, with hyperscaler AI spending projected to exceed $800