


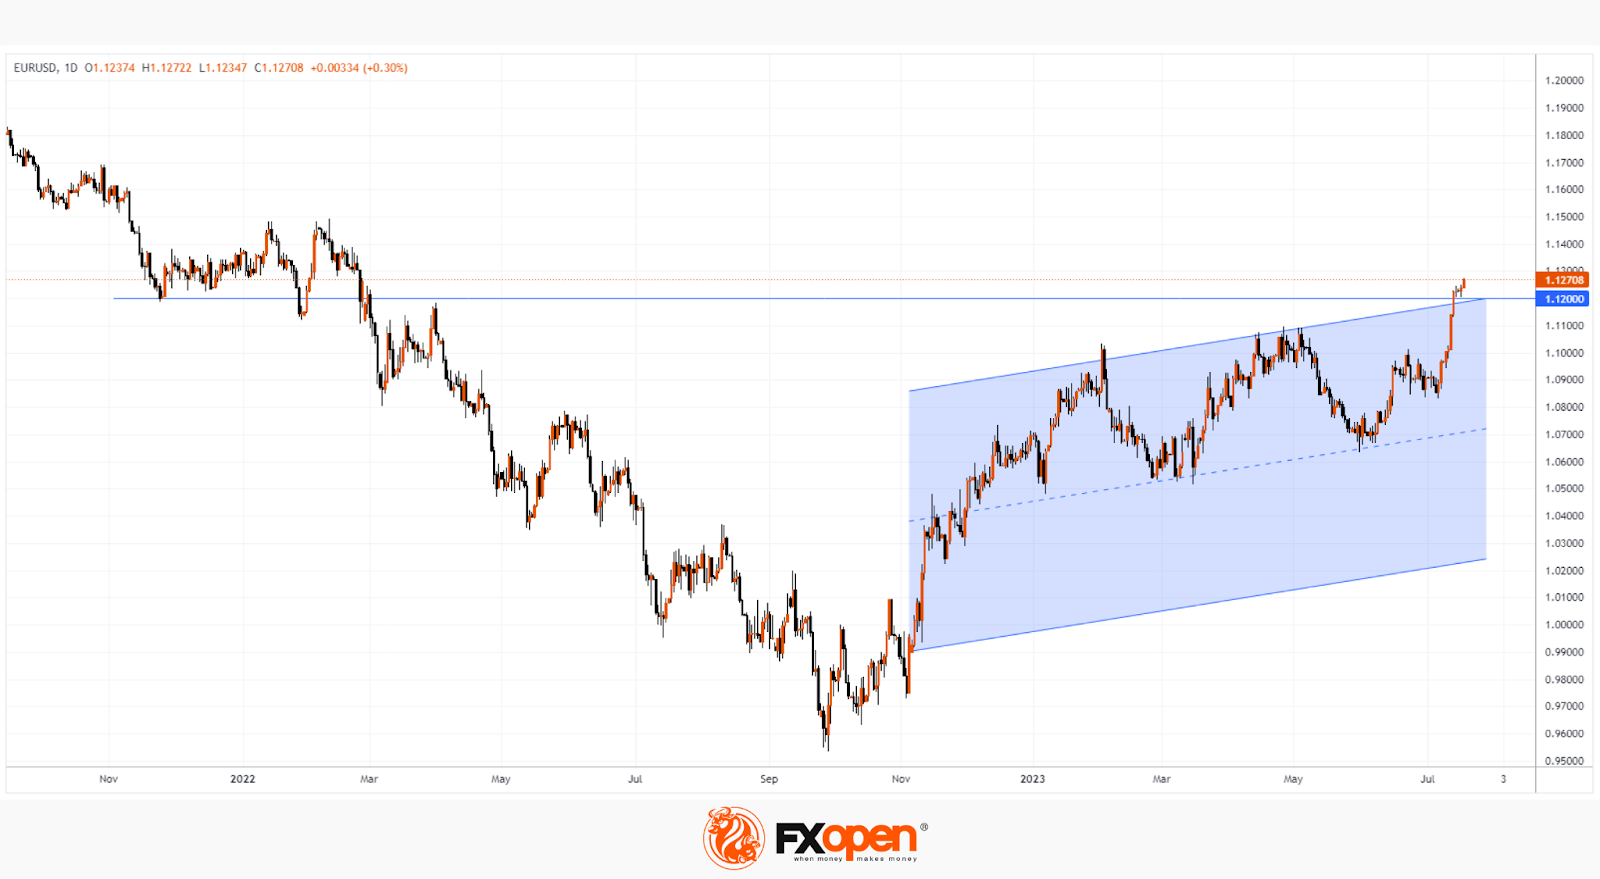
EUR/USD PRICE: 17-MONTH MAXIMUM
FXOpen
Last week, the dollar index posted its worst week of 2023 amid news of declining US inflation, which was seen as a motive for easing the Fed's current tight monetary policy. "I think the dollar can stay under selling pressure," Carol Kong, currency strategist at Commonwealth Bank of Australia, told Reuters.
On the other hand, inflation in the Eurozone is not declining as fast. FT writes that some ECB officials consider it necessary to raise the rate several more times after the summer meetings, which supports the euro.
The EUR/USD chart shows demand dominance. At the same time, the price of the euro against the dollar:
- rose above the 1.1200 level for the first time in 17 months. Note that this level has influenced the EUR/USD price dynamics in the past;
- went beyond the upper limit of the ascending channel.
Given these 2 observations, we can assume that the market is in a vulnerable position for a pullback, and the bulls will need to make specific efforts to gain a foothold above 1.1200.
The situation may change in the near future:
- US retail sales data to be released today at 15:30 GMT+3;
- Tomorrow at 12:00 GMT+3 inflation data in the Eurozone will be published.
Trade over 50 forex markets 24 hours a day with FXOpen. Take advantage of low commissions, deep liquidity, and spreads from 0.0 pips (additional fees may apply). Open your FXOpen account now or learn more about trading forex with FXOpen.
This article represents the opinion of the Companies operating under the FXOpen brand only. It is not to be construed as an offer, solicitation, or recommendation with respect to products and services provided by the Companies operating under the FXOpen brand, nor is it to be considered financial advice.
Stay ahead of the market!
Subscribe now to our mailing list and receive the latest market news and insights delivered directly to your inbox.


Latest articles

Weekly Market Insights with Gary Thomson: The Week of Central Banks and Earnings
In this video, we’ll explore the key economic events and market trends, shaping the financial landscape. Get ready for insights into financial markets to help you navigate the week ahead. Let’s dive in!
In this episode of Market

Intel at a Crossroads: Earnings Beat Meets Technical Resistance
Intel has just delivered its strongest quarter in over fifteen years, and the market reaction says it all. Q2 2026 revenue surged 25% year-over-year to $16.1 billion, crushing the consensus estimate of $14.42 billion, while adjusted EPS of

Tesla: Complex Range Structure Breaks Down Following Quarterly Earnings
Tesla released its Q2 2026 results after the market closed on 22 July. Revenue increased 26% year-on-year to $28.24 billion, while vehicle deliveries reached a record 480,126 units. However, operating margin fell sharply to 1.4%, down from