


EUR/USD PRICE ANALYSIS: UPDATE ON THE MARKET SITUATION
FXOpen
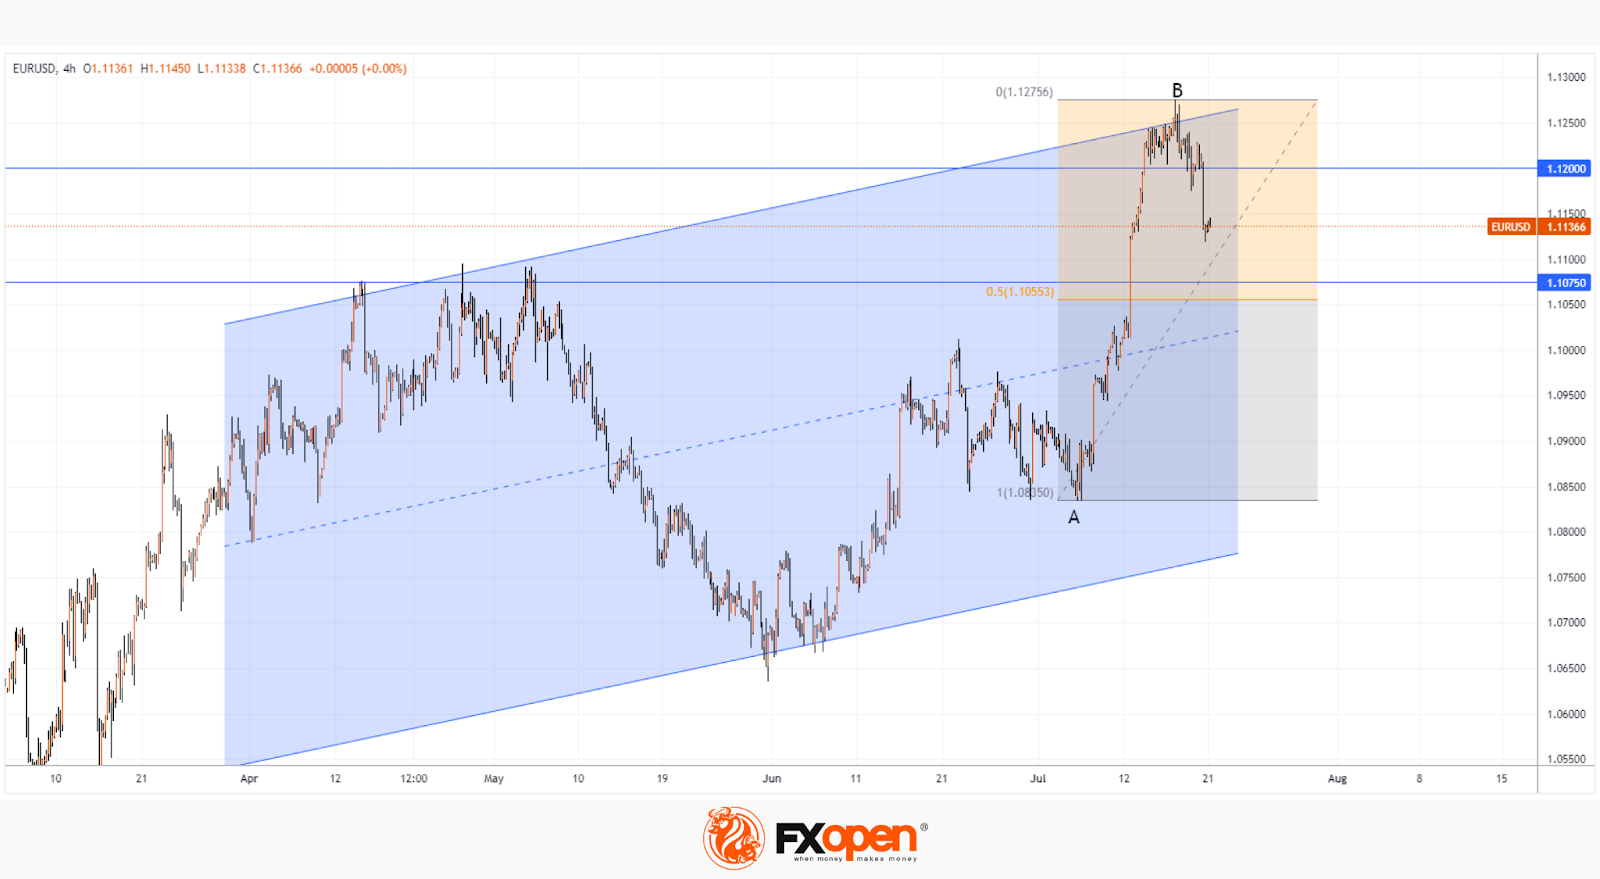
On July 18, we wrote about the vulnerability of the market to a rollback from the block of resistance, which is formed by the level of 1.12 euros per US dollar and the upper line of the rising channel. Since then, the EUR/USD price has fallen by more than 1%.
The most noticeable was yesterday's decline in the price of EUR/USD, which was due, among other things, to the rise in price of the dollar due to a strong report on the US labor market. Weekly data showed that jobless claims fell to a nearly 2-month low.
How deep can the EUR/USD price pull back from the resistance block?
If the decline continues, then, from the point of view of technical analysis, the horizontal level 1.075 can be considered the level at which the bulls can try to change the situation:
- in April-May this level worked as resistance;
- approximately, here passes the Fibonacci line 50% of the growth A→B.
The decision of the ECB to raise interest rates by 25 basis points could lead to bullish momentum in the EUR/USD price. The decision will be announced on July 27.
Trade over 50 forex markets 24 hours a day with FXOpen. Take advantage of low commissions, deep liquidity, and spreads from 0.0 pips (additional fees may apply). Open your FXOpen account now or learn more about trading forex with FXOpen.
This article represents the opinion of the Companies operating under the FXOpen brand only. It is not to be construed as an offer, solicitation, or recommendation with respect to products and services provided by the Companies operating under the FXOpen brand, nor is it to be considered financial advice.
Stay ahead of the market!
Subscribe now to our mailing list and receive the latest market news and insights delivered directly to your inbox.


Latest articles

AUD/CAD: Months of Indecision — Is a Breakout Finally Coming?
The Australian dollar has clawed back most of its end-of-June losses, when it touched three-month lows against the greenback amid escalating Middle East tensions. Since then, sentiment has improved: the RBA's Assistant Governor Sarah Hunter signalled the board stands ready

USD/JPY: Battling at the Top of the Triangle
On 3 July, Japan's Finance Minister, Satsuki Katayama, stated that the Ministry of Finance remains in close contact with US authorities regarding developments in USD/JPY as the yen traded near its weakest level in almost 40 years. Similar verbal

Dow Jones (DJIA): Consolidation Beyond the Trend
Federal Reserve Chair Kevin Warsh testified before Congress on 14–15 July, reaffirming the Fed's commitment to bringing inflation back to target while providing no clear guidance on the future path of interest rates. Meanwhile, June inflation data came in