


EURJPY Analysis: Highest Since Fall 2008
FXOpen

Yen Weakening Drivers:
→ rising prices for energy resources. After all, Japan is a major importer.
→ The inflation index CGPI (corporate goods price index) indicates a slowdown in inflation. Therefore, this raises the likelihood that the Bank of Japan will maintain an ultra-loose monetary policy.
The growth of the euro against the yen is facilitated by the fact that the ECB is pursuing a tough policy. Market participants expect that another rate increase could be made in autumn.
The EUR/JPY chart shows that the rate is in an uptrend. The market recovered quickly from the sharp decline on July 27, a testament to the strength of demand. Another piece of evidence is the amount of B→C retracement after A→B rises. It was only about 30% of the momentum.
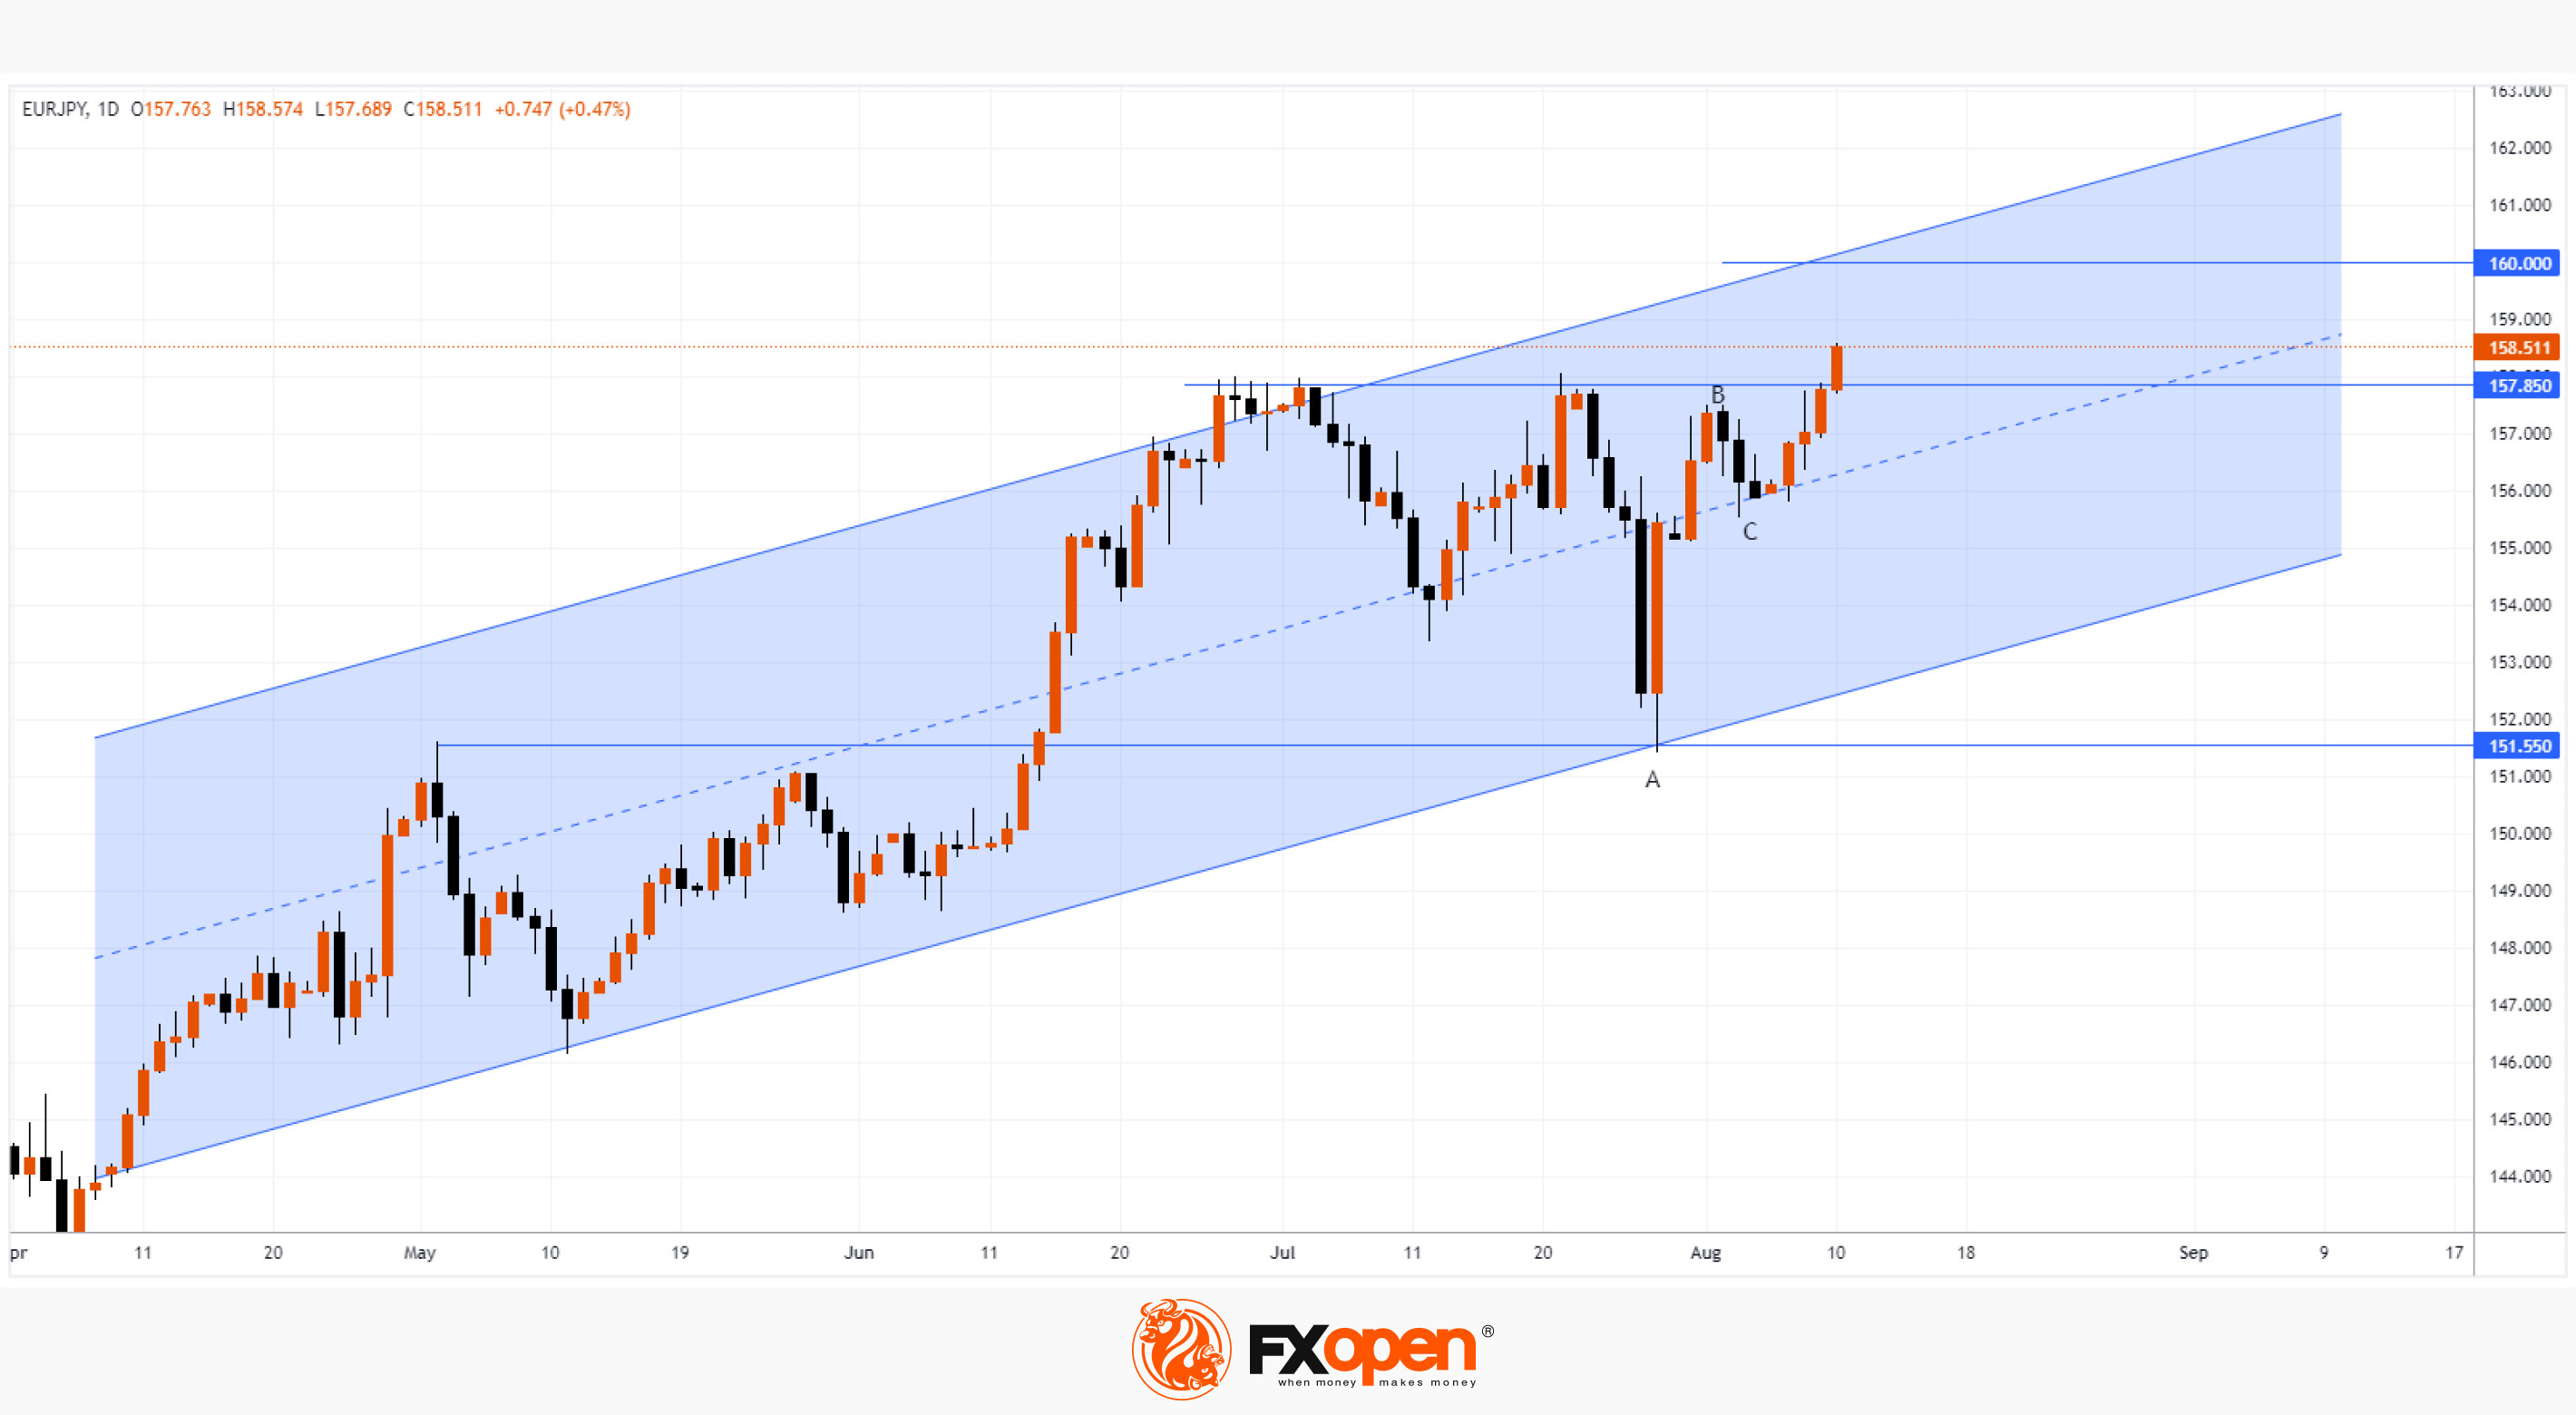
Support levels:
→ 157.85. After the breakout by the bulls, the previous resistance may provide support, as was the case with the 151.55 level, which worked as a resistance in May, but provided support at the end of June;
→ median channel line.
Resistance Levels:
→ upper border of the channel;
→ the psychological level of 160 yen per euro.
Today (at 15:30 GMT+3) inflation news in the US is expected, which can shake financial markets a lot.
Trade over 50 forex markets 24 hours a day with FXOpen. Take advantage of low commissions, deep liquidity, and spreads from 0.0 pips (additional fees may apply). Open your FXOpen account now or learn more about trading forex with FXOpen.
This article represents the opinion of the Companies operating under the FXOpen brand only. It is not to be construed as an offer, solicitation, or recommendation with respect to products and services provided by the Companies operating under the FXOpen brand, nor is it to be considered financial advice.
Stay ahead of the market!
Subscribe now to our mailing list and receive the latest market news and insights delivered directly to your inbox.


Latest articles

Weekly Market Insights with Gary Thomson: The Week of Central Banks and Earnings
In this video, we’ll explore the key economic events and market trends, shaping the financial landscape. Get ready for insights into financial markets to help you navigate the week ahead. Let’s dive in!
In this episode of Market

Intel at a Crossroads: Earnings Beat Meets Technical Resistance
Intel has just delivered its strongest quarter in over fifteen years, and the market reaction says it all. Q2 2026 revenue surged 25% year-over-year to $16.1 billion, crushing the consensus estimate of $14.42 billion, while adjusted EPS of

Tesla: Complex Range Structure Breaks Down Following Quarterly Earnings
Tesla released its Q2 2026 results after the market closed on 22 July. Revenue increased 26% year-on-year to $28.24 billion, while vehicle deliveries reached a record 480,126 units. However, operating margin fell sharply to 1.4%, down from