


FXOpen
Today, the Eurostoxx 50 index (Europe 50 on FXOpen) has dropped below the early May minimum, reflecting escalating market concerns over the upcoming French elections, as reported by Reuters. Finance Minister Bruno Le Maire's acknowledgment that the current political crisis could evolve into a financial crisis has amplified fears, extending the political risk until June.
How long might this decline persist?
Fundamentally, statements from authorities could calm the markets.
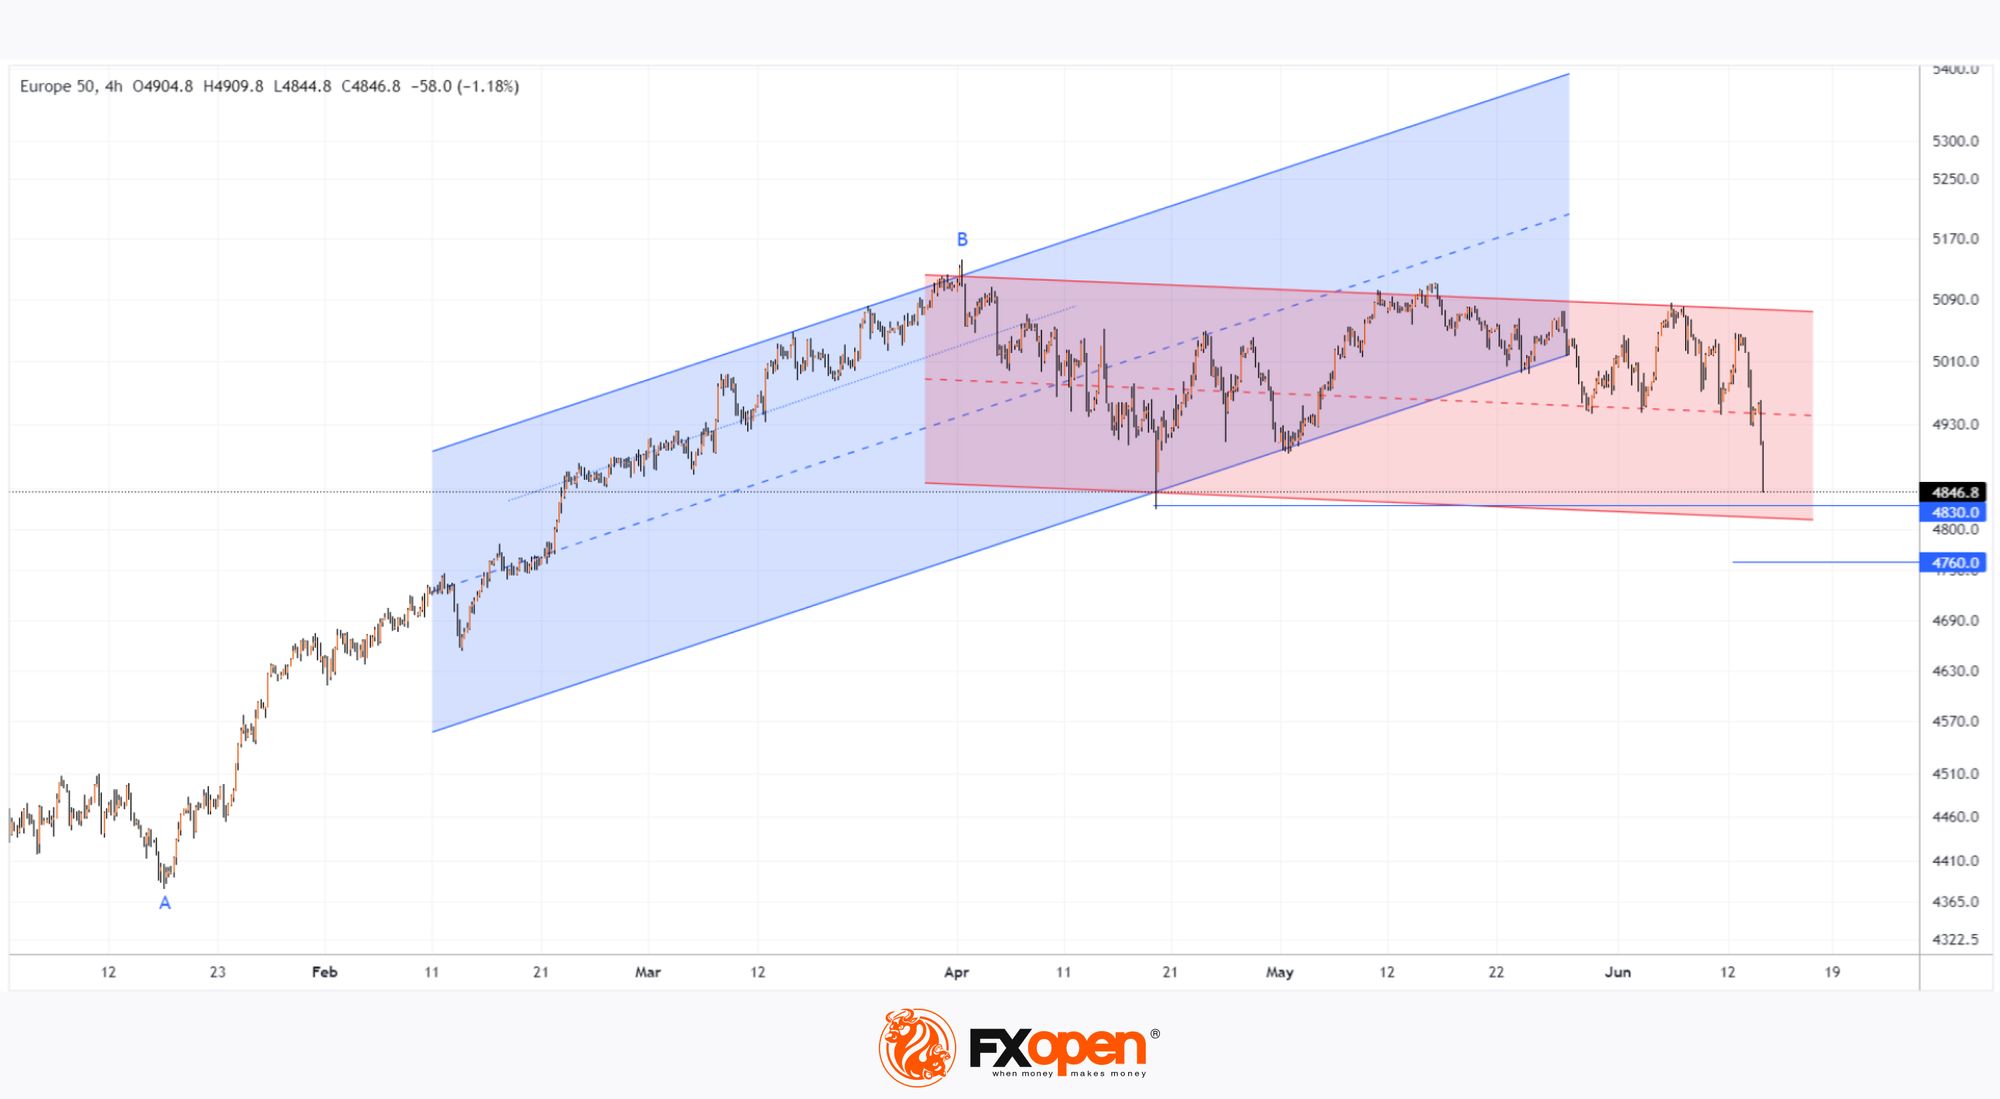
From a technical analysis perspective, the Eurostoxx 50 index chart (Europe 50 on FXOpen) provides clearer insights:
→ Since February, the price has been in an upward trend (shown in blue), but this trend was broken in late May after bouncing off the lower boundary of the channel.
→ This breakdown has led to the formation of a downward trend (shown in red).
→ The lower boundary of the parallel descending channel around 4813 could potentially act as a level where the market finds support after the decline triggered by the political backdrop. However, a false breakout below the April minimum around 4830 cannot be ruled out.
Additionally, the price may find support:
→ Near the 50% Fibonacci retracement level of the bullish impulse A→B around 4760.
→ Around the psychological level of 4800.
On the contrary, resistance may be encountered near the median of the descending channel around 4940 during attempts at recovery.
Trade global index CFDs with zero commission and tight spreads (additional fees may apply). Open your FXOpen account now or learn more about trading index CFDs with FXOpen.
This article represents the opinion of the Companies operating under the FXOpen brand only. It is not to be construed as an offer, solicitation, or recommendation with respect to products and services provided by the Companies operating under the FXOpen brand, nor is it to be considered financial advice.
Stay ahead of the market!
Subscribe now to our mailing list and receive the latest market news and insights delivered directly to your inbox.


Latest articles

Market Analysis: GBP/USD Dips Further As EUR/GBP Regains Traction
GBP/USD failed to climb above 1.3500 and corrected some gains. EUR/GBP started a decent increase and might aim for more gains above 0.8700.
Important Takeaways for GBP/USD and EUR/GBP Analysis Today
· The British Pound


Market Insights with Gary Thomson: Oil, US Retail Sales & NFP in Focus
In this video, we’ll explore the key economic events and market trends, shaping the financial landscape. Get ready for insights into financial markets to help you navigate the week ahead. Let’s dive in!
In this episode of Market