


European Stocks Rise for Sixth Consecutive Week
FXOpen

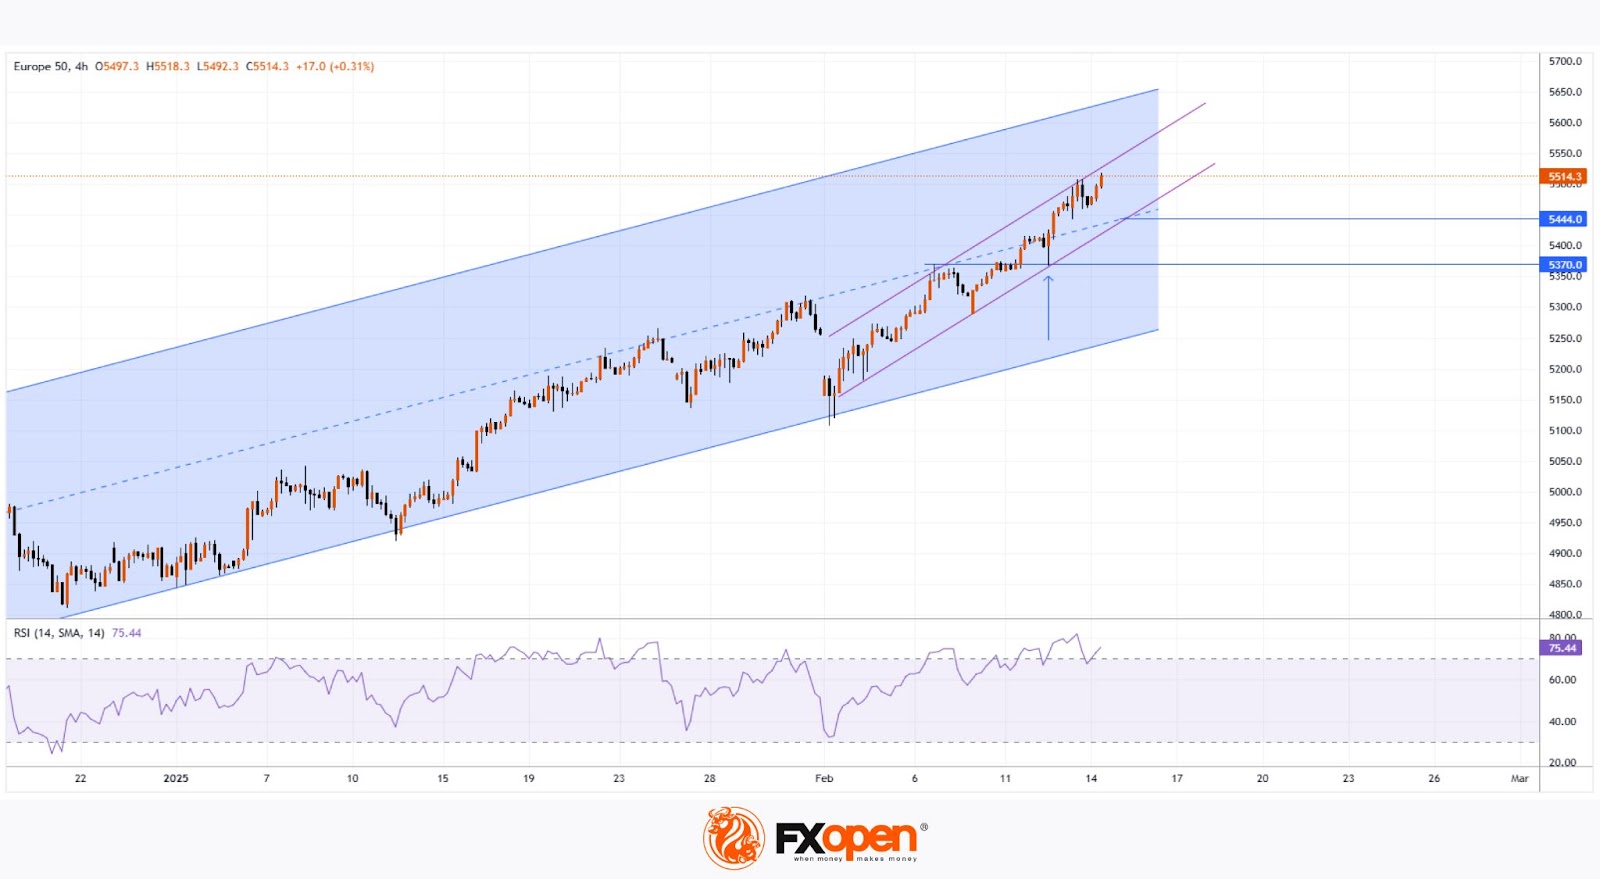
According to the Eurostoxx 50 index (Europe 50 on FXOpen) chart:
→ The index has gained over 6% since early February.
→ It is now trading at an all-time high.
Factors driving market optimism:
→ Expectations of a ceasefire in Ukraine.
→ Trump’s decision to delay tariff implementation until April, signalling room for trade negotiations.
Technical Analysis of the Eurostoxx 50 Index (Europe 50 on FXOpen)
Price movements outline an ascending channel (blue), with key observations:
→ The index remains in the upper half of the channel, reflecting strong demand.
→ February’s sharp rally has formed a steeper rising channel (purple).
→ After breaking above resistance at 5,370, a retest (indicated by an arrow) confirmed this level as support.
With the RSI indicator in overbought territory, a potential pullback is plausible—perhaps as investors look to secure profits before the weekend amid a busy news cycle.
In this scenario, the 5,444 level, where the lower purple trendline intersects the blue channel’s median, could act as a support zone.
Trade global index CFDs with zero commission and tight spreads (additional fees may apply). Open your FXOpen account now or learn more about trading index CFDs with FXOpen.
This article represents the opinion of the Companies operating under the FXOpen brand only. It is not to be construed as an offer, solicitation, or recommendation with respect to products and services provided by the Companies operating under the FXOpen brand, nor is it to be considered financial advice.
Stay ahead of the market!
Subscribe now to our mailing list and receive the latest market news and insights delivered directly to your inbox.


Latest articles

Market Analysis: EUR/USD Breakout Builds, USD/CHF Slides Lower Again
EUR/USD started a fresh surge above 1.1740 and 1.1780. USD/CHF declined further and is now struggling below 0.7850.
Important Takeaways for EUR/USD and USD/CHF Analysis Today
· The Euro started a major increase from

USD/JPY and USD/CAD Under Pressure: Dollar Tests Key Levels
The US dollar remains under pressure, testing key support levels amid expectations of easing geopolitical tensions. The market continues to price in the possibility of renewed negotiations between the US and Iran, reducing demand for the dollar as a safe-haven

Natural Gas: Key Support Amid Renewed Escalation
A key development on 13 April was the start of a naval blockade of Iranian ports, a direct consequence of the collapse of negotiations in Islamabad on 12 April. The blockade covers all vessels entering and leaving Iranian ports in