


FXOpen
As indicated by the chart of the Eurostoxx 50 index (Europe 50 on FXOpen), its value climbed above the psychological level of 5000 points in early 2025.
The strength of demand may be driven by portfolio rebalancing or long-term investor expectations, as today’s news for the European stock market was negative. According to ForexFactory:
→ industrial orders in Germany dropped by 5.1% month-on-month (expected: -0.3%);
→ retail sales in Germany fell by 0.6% month-on-month (expected: +0.5%);
→ France reported a worsening government budget balance.
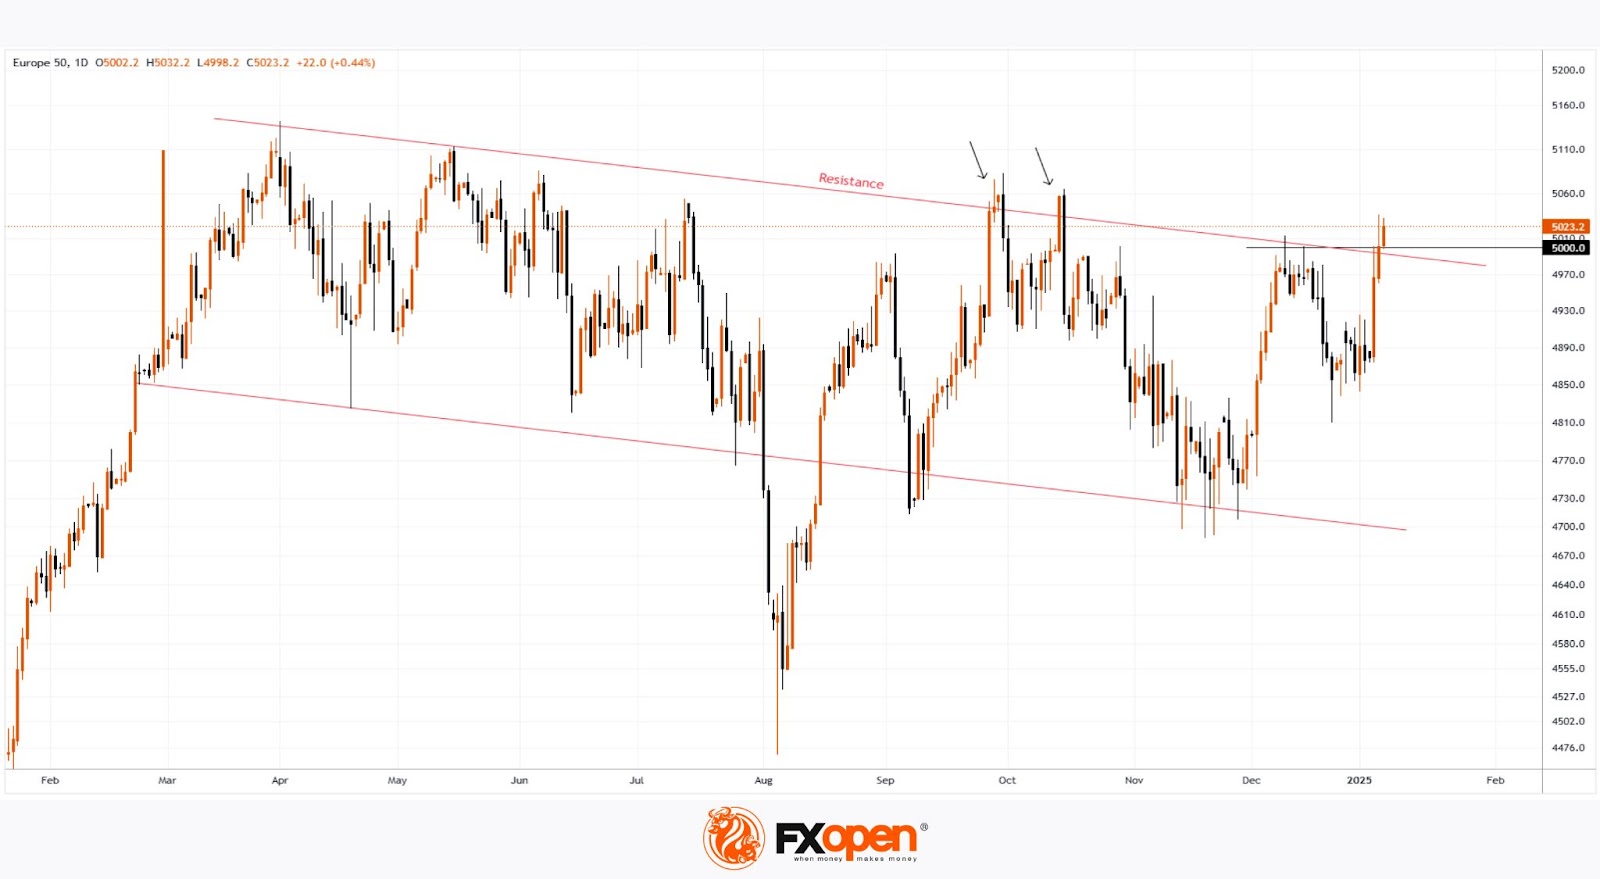
A technical analysis of the Eurostoxx 50 index (Europe 50 on FXOpen) chart shows that:
→ the current value is above a resistance line (shown in red), which dates back to spring 2024;
→ since then, bulls have made two attempts to break above this line (marked with arrows) but failed to sustain the gains.
It is possible that further negative economic news from Europe could trigger bearish activity—if so, we may witness a third unsuccessful attempt to hold above the red resistance line, potentially resulting in the formation of a false breakout pattern.
Trade global index CFDs with zero commission and tight spreads (additional fees may apply). Open your FXOpen account now or learn more about trading index CFDs with FXOpen.
This article represents the opinion of the Companies operating under the FXOpen brand only. It is not to be construed as an offer, solicitation, or recommendation with respect to products and services provided by the Companies operating under the FXOpen brand, nor is it to be considered financial advice.
Stay ahead of the market!
Subscribe now to our mailing list and receive the latest market news and insights delivered directly to your inbox.


Latest articles

Market Analysis: GBP/USD Dips Further As EUR/GBP Regains Traction
GBP/USD failed to climb above 1.3500 and corrected some gains. EUR/GBP started a decent increase and might aim for more gains above 0.8700.
Important Takeaways for GBP/USD and EUR/GBP Analysis Today
· The British Pound


Market Insights with Gary Thomson: Oil, US Retail Sales & NFP in Focus
In this video, we’ll explore the key economic events and market trends, shaping the financial landscape. Get ready for insights into financial markets to help you navigate the week ahead. Let’s dive in!
In this episode of Market