


FXOpen

On Friday, the FTSE 100 index rose by 0.4% to 8273 points, continuing its 0.9% rise on Thursday. According to Trading Economics, the centre-left Labour Party, as expected, won the parliamentary elections and secured a majority, ousting the Conservative Party after 14 years in power.
The Labour Party emphasised the importance of economic stability in its decisions and committed to strict budgetary spending rules.
Prime Minister Sunak conceded defeat, and the UK stock market positively received the official election results. As shown by the chart, the FTSE 100 index (UK 100 on FXOpen) has risen by approximately 1.9% from the July 2nd low.
However, the situation remains unfavourable for the bulls.
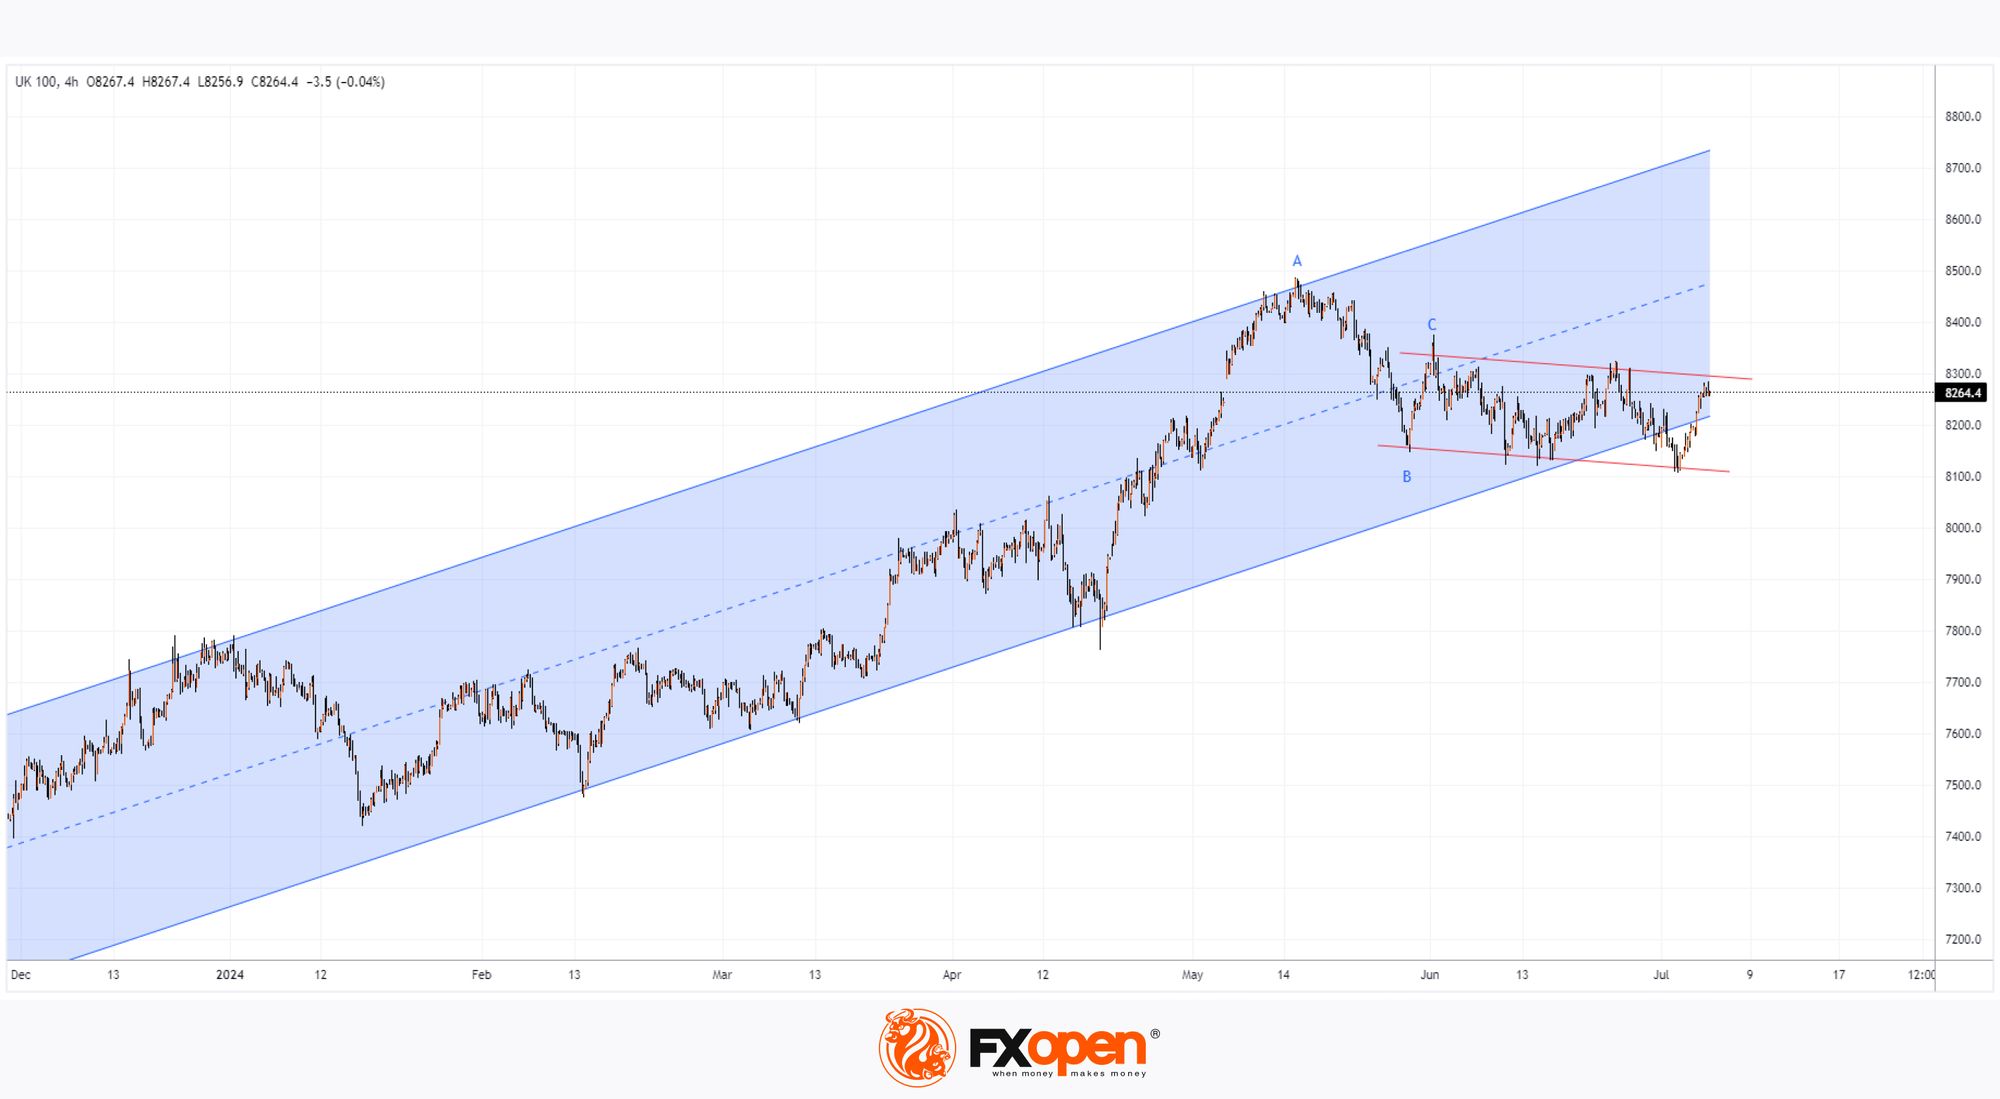
According to the technical analysis of the FTSE 100 (UK 100 on FXOpen) chart:
→ the market has formed an upward trend (shown in blue), but its relevance remains in question;
→ the B→C rise constitutes 50% of the A→B downward impulse – a bearish sign;
→ in June, the price formed a range zone (shown with red lines), within which it currently resides.
In a favourable scenario, the bulls may break the upper boundary of the red range to return within the long-term channel.
Otherwise, the long-term blue channel will lose its relevance, and the Labour Party may experience a period of decline in the FTSE 100 index (UK 100 on FXOpen) early in their term.
Trade global index CFDs with zero commission and tight spreads (additional fees may apply). Open your FXOpen account now or learn more about trading index CFDs with FXOpen.
This article represents the opinion of the Companies operating under the FXOpen brand only. It is not to be construed as an offer, solicitation, or recommendation with respect to products and services provided by the Companies operating under the FXOpen brand, nor is it to be considered financial advice.
Stay ahead of the market!
Subscribe now to our mailing list and receive the latest market news and insights delivered directly to your inbox.


Latest articles

European Currencies Decline: Pound Hits New Lows, Euro Under Pressure
European currencies continue to weaken against the US dollar amid rising geopolitical tensions and increased demand for safe-haven and liquid assets. Market participants are reducing exposure to riskier instruments, putting pressure on both the euro and the pound. Additional support

Market Analysis: GBP/USD Dips Further As EUR/GBP Regains Traction
GBP/USD failed to climb above 1.3500 and corrected some gains. EUR/GBP started a decent increase and might aim for more gains above 0.8700.
Important Takeaways for GBP/USD and EUR/GBP Analysis Today
· The British Pound
