


FXOpen

The British stock index FTSE 100 (UK 100 on FXOpen) dropped nearly 1% yesterday due to the release of economic data indicating a rise in unemployment.
According to ForexFactory:
→ The Claimant Count Change (number of unemployment benefit claims) was 50,000 (expected = 10.2k, previous month = 8.4k). This is the highest number since March 2021.
→ The unemployment rate slightly increased to 4.4% compared to the previous value of 4.3%.
However, today the FTSE 100 (UK 100 on FXOpen) chart is showing signs of recovery.
Fundamentally:
→ GDP news did not bring any unpleasant surprises;
→ Weakening in the labour market might prompt the Bank of England to lower the interest rate to stimulate the economy, which should support the stock index.
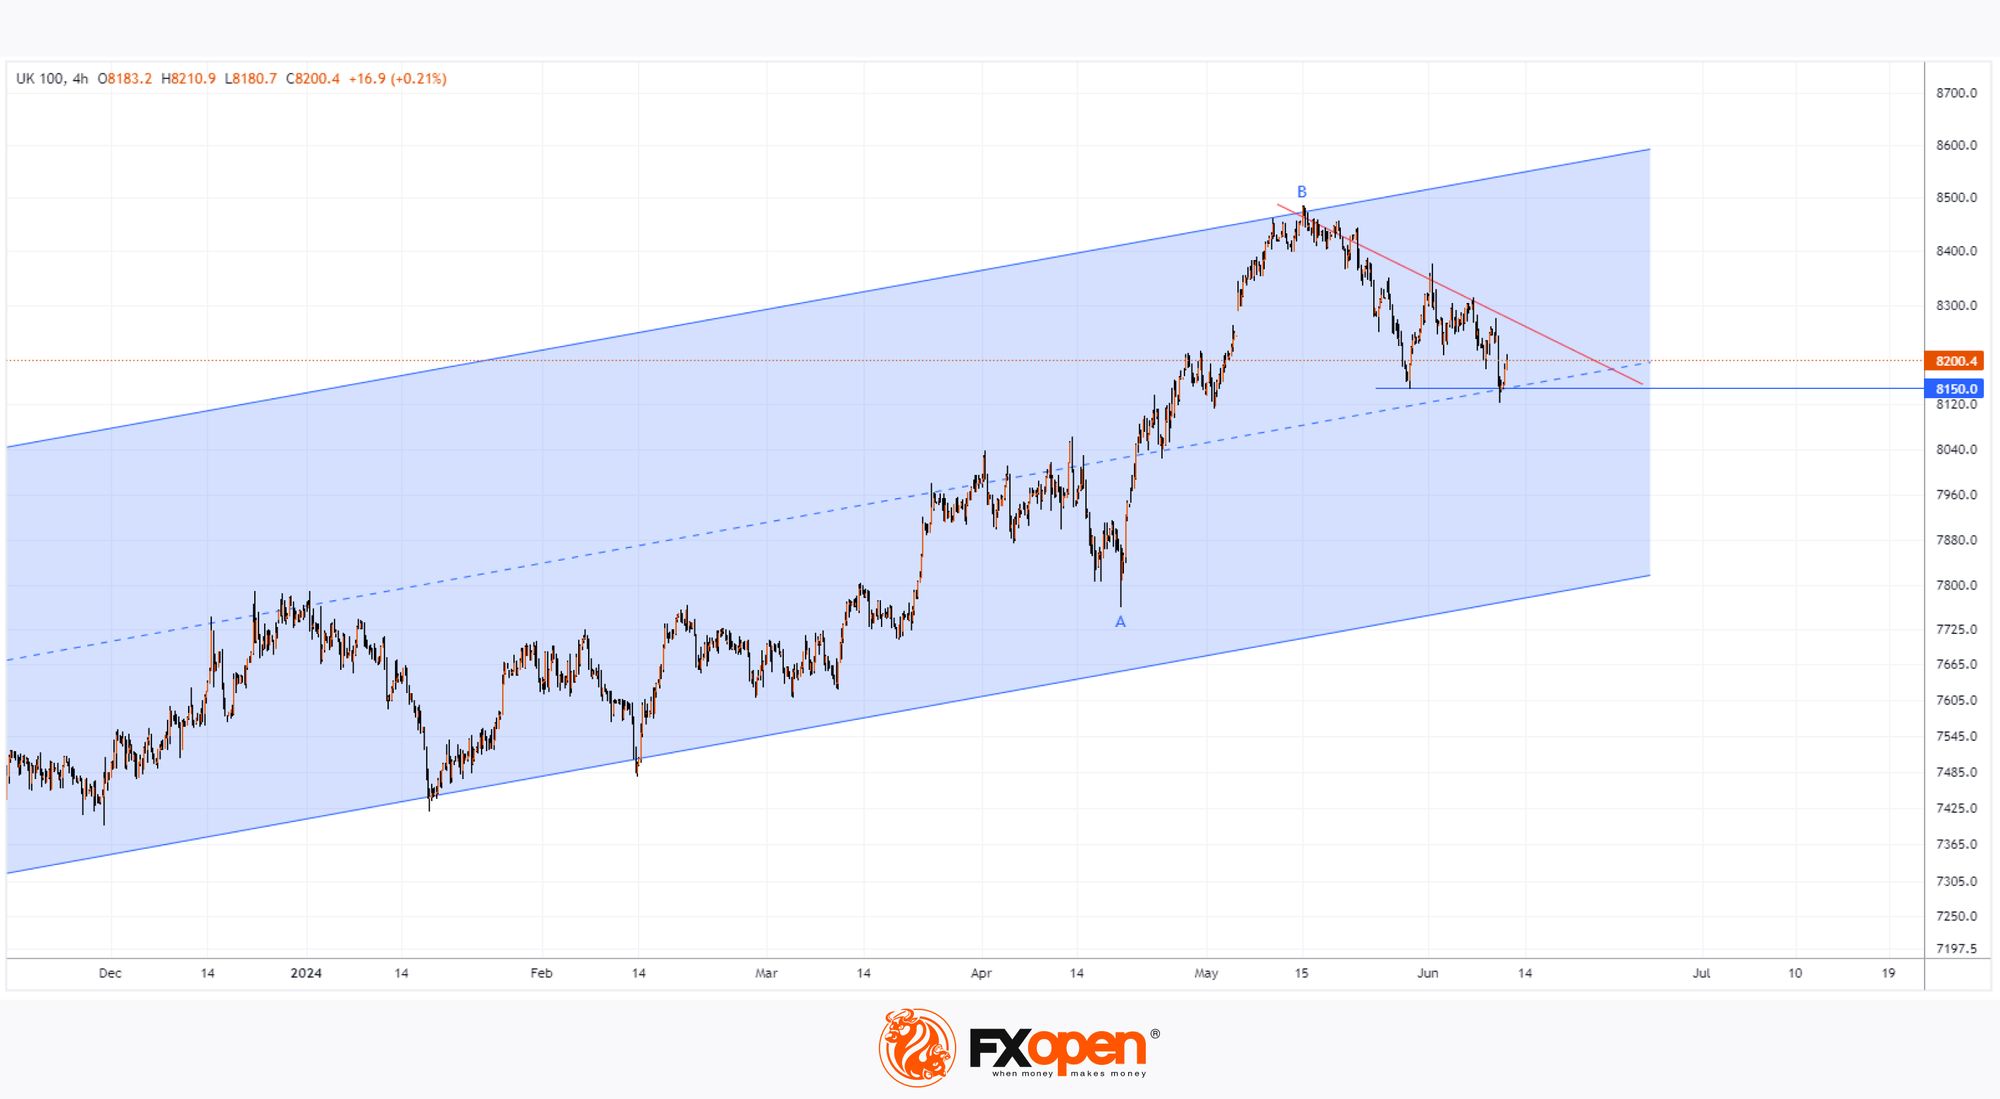
From a Technical Analysis Perspective of the FTSE 100 (UK 100 on FXOpen):
→ At the low of the decline, the price found support at the median line of the upward channel that has been in place since last autumn (shown in blue);
→ The median line is reinforced by the 50% Fibonacci retracement level from the bullish impulse A→B;
→ The price failed to consolidate below the late May low around the 8150 level, indicating a local capitulation of bears.
Bulls, on the other hand, might use these technical support factors to attempt to resume the upward trend within the blue channel. To do this, they will need to break the resistance of the trend line (shown in red).
Trade global index CFDs with zero commission and tight spreads (additional fees may apply). Open your FXOpen account now or learn more about trading index CFDs with FXOpen.
This article represents the opinion of the Companies operating under the FXOpen brand only. It is not to be construed as an offer, solicitation, or recommendation with respect to products and services provided by the Companies operating under the FXOpen brand, nor is it to be considered financial advice.
Stay ahead of the market!
Subscribe now to our mailing list and receive the latest market news and insights delivered directly to your inbox.


Latest articles

European Currencies Decline: Pound Hits New Lows, Euro Under Pressure
European currencies continue to weaken against the US dollar amid rising geopolitical tensions and increased demand for safe-haven and liquid assets. Market participants are reducing exposure to riskier instruments, putting pressure on both the euro and the pound. Additional support

Market Analysis: GBP/USD Dips Further As EUR/GBP Regains Traction
GBP/USD failed to climb above 1.3500 and corrected some gains. EUR/GBP started a decent increase and might aim for more gains above 0.8700.
Important Takeaways for GBP/USD and EUR/GBP Analysis Today
· The British Pound
