


FXOpen

The cost of oil futures on the NYMEX exchange at the beginning of the week is $82.48. Gas futures price on the same exchange at the same moment is $2.15. The ratio of oil to gas contracts is 38.36 ($82.48 / $2.15). And on Friday, it was above 40 — the last time such a proportion was in May 2012.
For many years, the oil/gas ratio has not exceeded 25-30. But a mild winter in the US, which pushed down gas prices, plus the recent OPEC+ decision on oil production caps, have all pushed the ratio to an anomaly. But it looks like it may be back to more familiar levels as the daily natural gas price chart sends two bullish signals:
1 → false bearish breakdown of the low of the year;
2 → bullish gap at the week open.
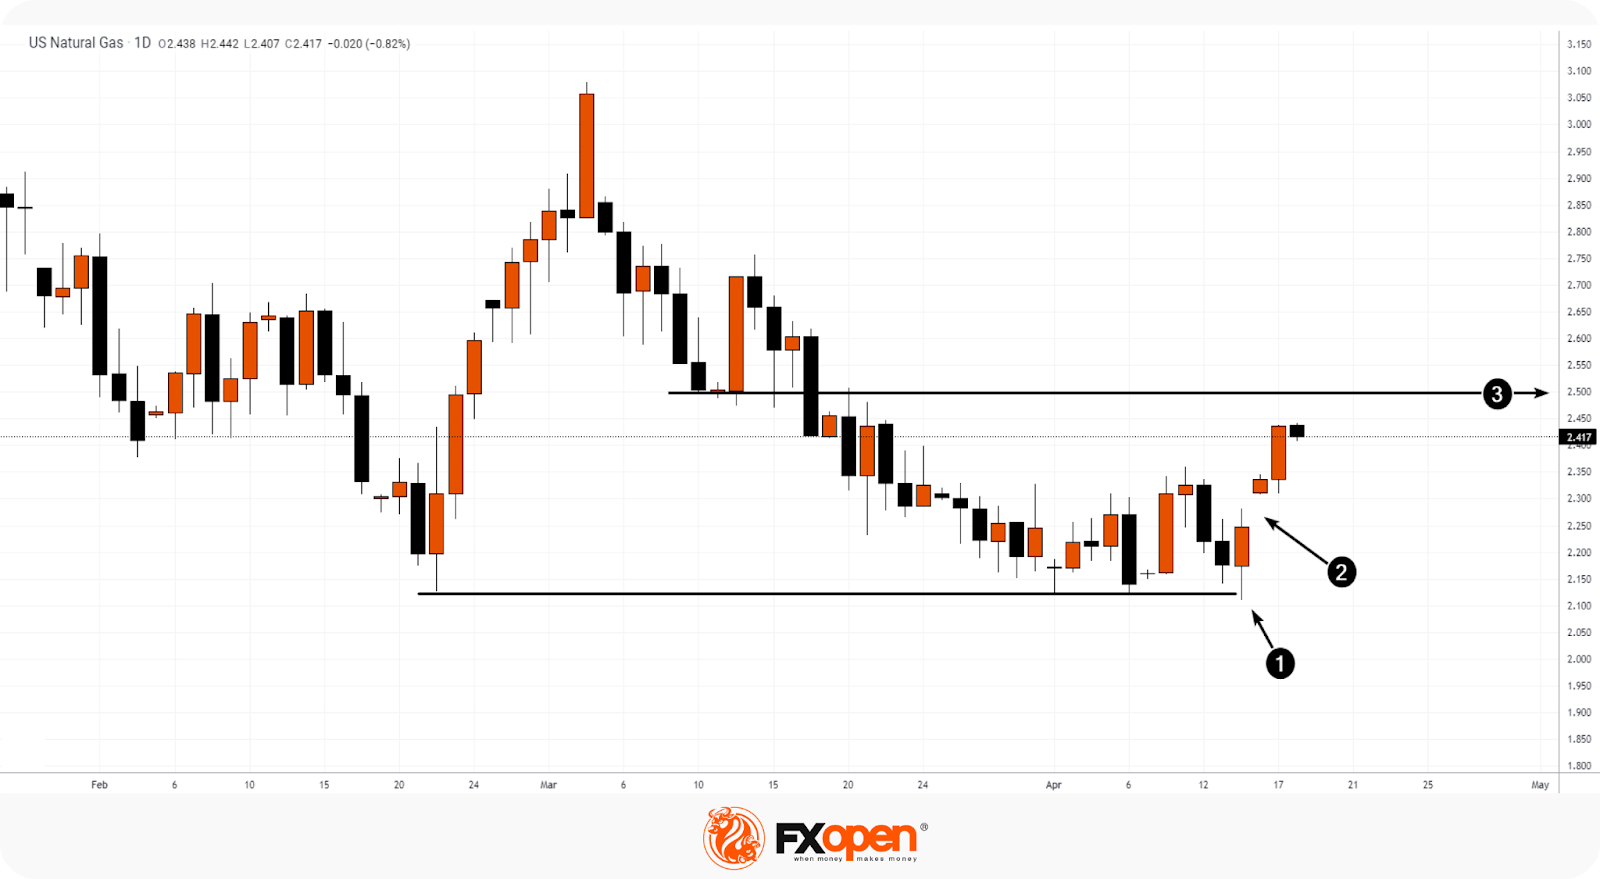
The last two long bullish candles indicate that demand is dominating. It is possible that the price may reach the psychological (3) level of $2.5 (which served as both support and resistance in March) and continue to grow — we recall that according to the forecast of the US Energy Information Administration, the gas price for 2023 should be $3.13 (almost +40% from current values).
This forecast represents FXOpen Companies opinion only, it should not be construed as an offer, invitation or recommendation in respect of FXOpen Companies products and services or as financial advice.
Start trading commodity CFDs with tight spreads (additional fees may apply). Open your trading account now or learn more about trading commodity CFDs with FXOpen.
This article represents the opinion of the Companies operating under the FXOpen brand only. It is not to be construed as an offer, solicitation, or recommendation with respect to products and services provided by the Companies operating under the FXOpen brand, nor is it to be considered financial advice.
Stay ahead of the market!
Subscribe now to our mailing list and receive the latest market news and insights delivered directly to your inbox.


Latest articles

The US Dollar Index (DXY) Climbs to a One-and-a-Half-Month High
Today, the US Dollar Index rose above the 98.70 level for the first time since the third week of January. Monday’s trading opened with a bullish gap, and upward momentum continues to build as news emerges of a

Iran Conflict and Economic Data: Events in Focus for 2-6 March
Let’s discuss three upcoming events that may impact market activity across currencies, equities, and commodities.
✔️Washington and Israel struck Iran, the supreme leader of Iran Ayatollah Khamenei was killed. Iran retaliated, escalating tensions.
Oil jumped over 8%, global stocks

WTI Oil Trading Opens with a 10% Bullish Gap
On Friday, we warned that trading on Monday could be volatile — but not to this extent! The situation sharply escalated over the weekend following a large-scale strike by Israel and the US on targets in Iran, during which the supreme