


Fundamental Analysis on April 19, 2023: European Stocks at Historical Highs
FXOpen

Yesterday, the Europe 50 index was at a high of 4,416.8 points, which exceeds the highs of autumn 2021. Here are the factors that contribute to the more bullish dynamics of European stocks compared to US stocks:
→ the banking crisis affected European banks to a lesser extent than in the US;
→ the growth of the Chinese economy, in relations with which Europe has fewer restrictions than the United States (Macron's recent visit to China confirms this);
→ strong performance in selected sectors: luxury goods and aircraft manufacturing in France and automotive manufacturing in Germany.
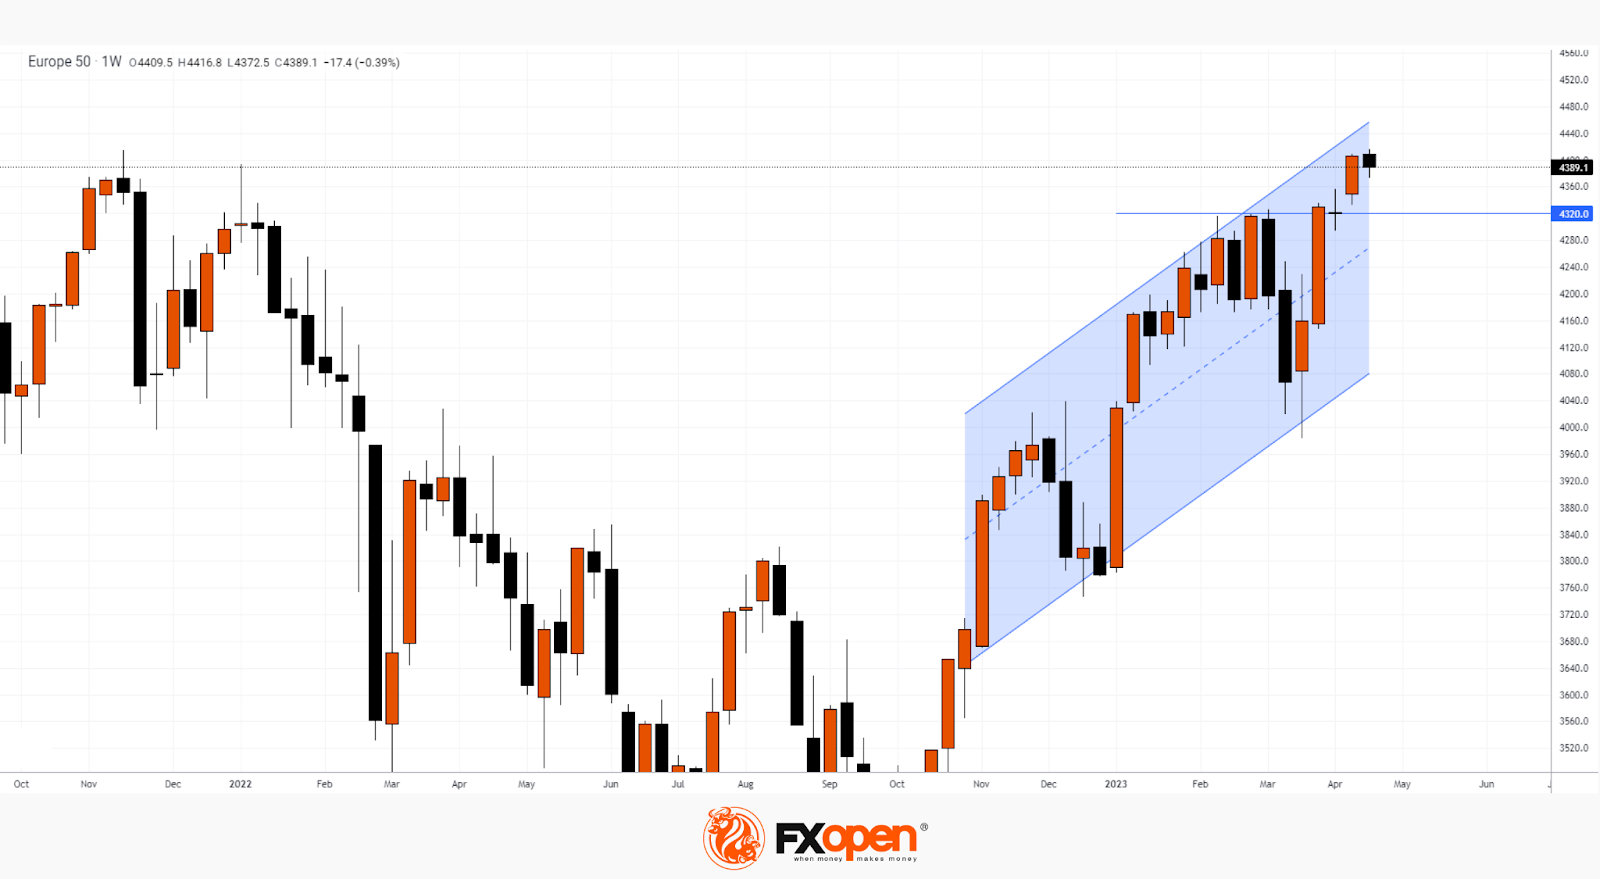
On Friday morning, releases of PMI data in Germany and France are expected, which can push the stock market to new heights or lead it into a correction. In the second scenario, the level of 4,320 may support the European stock market, as well as the median line of the rising channel (shown in blue).
This forecast represents FXOpen Companies' opinion only, it should not be construed as an offer, invitation, or recommendation in respect of FXOpen Companies' products and services or as financial advice.
Buy and sell stocks of the world's biggest publicly-listed companies with CFDs on FXOpen’s trading platform. Open your FXOpen account now or learn more about trading share CFDs with FXOpen.
This article represents the opinion of the Companies operating under the FXOpen brand only. It is not to be construed as an offer, solicitation, or recommendation with respect to products and services provided by the Companies operating under the FXOpen brand, nor is it to be considered financial advice.
Stay ahead of the market!
Subscribe now to our mailing list and receive the latest market news and insights delivered directly to your inbox.


Latest articles

EUR/USD Eyes Gains As USD/CHF Weakness Deepens Again
EUR/USD started a fresh increase above 1.1700 and 1.1720. USD/CHF declined further and is now struggling below 0.7835.
Important Takeaways for EUR/USD and USD/CHF Analysis Today
· The Euro started a decent increase from

Apple: Earnings Day Above the Activity Zone
On 30 April, after the market close, Apple Inc. will release its financial results for the second quarter of fiscal 2026. The consensus forecast, based on estimates from 31 analysts, points to revenue of around $109.7 billion, with expected

USD/JPY and USD/CHF Near Key Levels: The Dollar Supported by the Fed
The US dollar continues to trend upwards following the Federal Reserve meeting, drawing support from the regulator’s moderately hawkish stance and comments by Jerome Powell. Markets interpret the Fed’s rhetoric as a signal that restrictive policy is likely