


GBP/JPY Analysis: a Deceptive Calm
FXOpen

From early January to today, the GBP/JPY rate has risen by approximately 17%, driven by the Bank of Japan's ultra-loose policy of keeping rates below zero.
But since August, the upward trend began to weaken — perhaps faith in the pound was undermined by high inflation (the highest among the G7). This week:
→ data published on Wednesday showed that inflation in the UK has stabilized at 6.7%. In an interview with the Belfast Telegraph published on Friday, Andrew Bailey appeared calm when he said the Bank of England did not expect big changes in the data anyway;
→ retail sales data for September in the UK published on Friday turned out to be worse than expected: actual = -0.9%, expected = -0.3%, a month ago = +0.4%
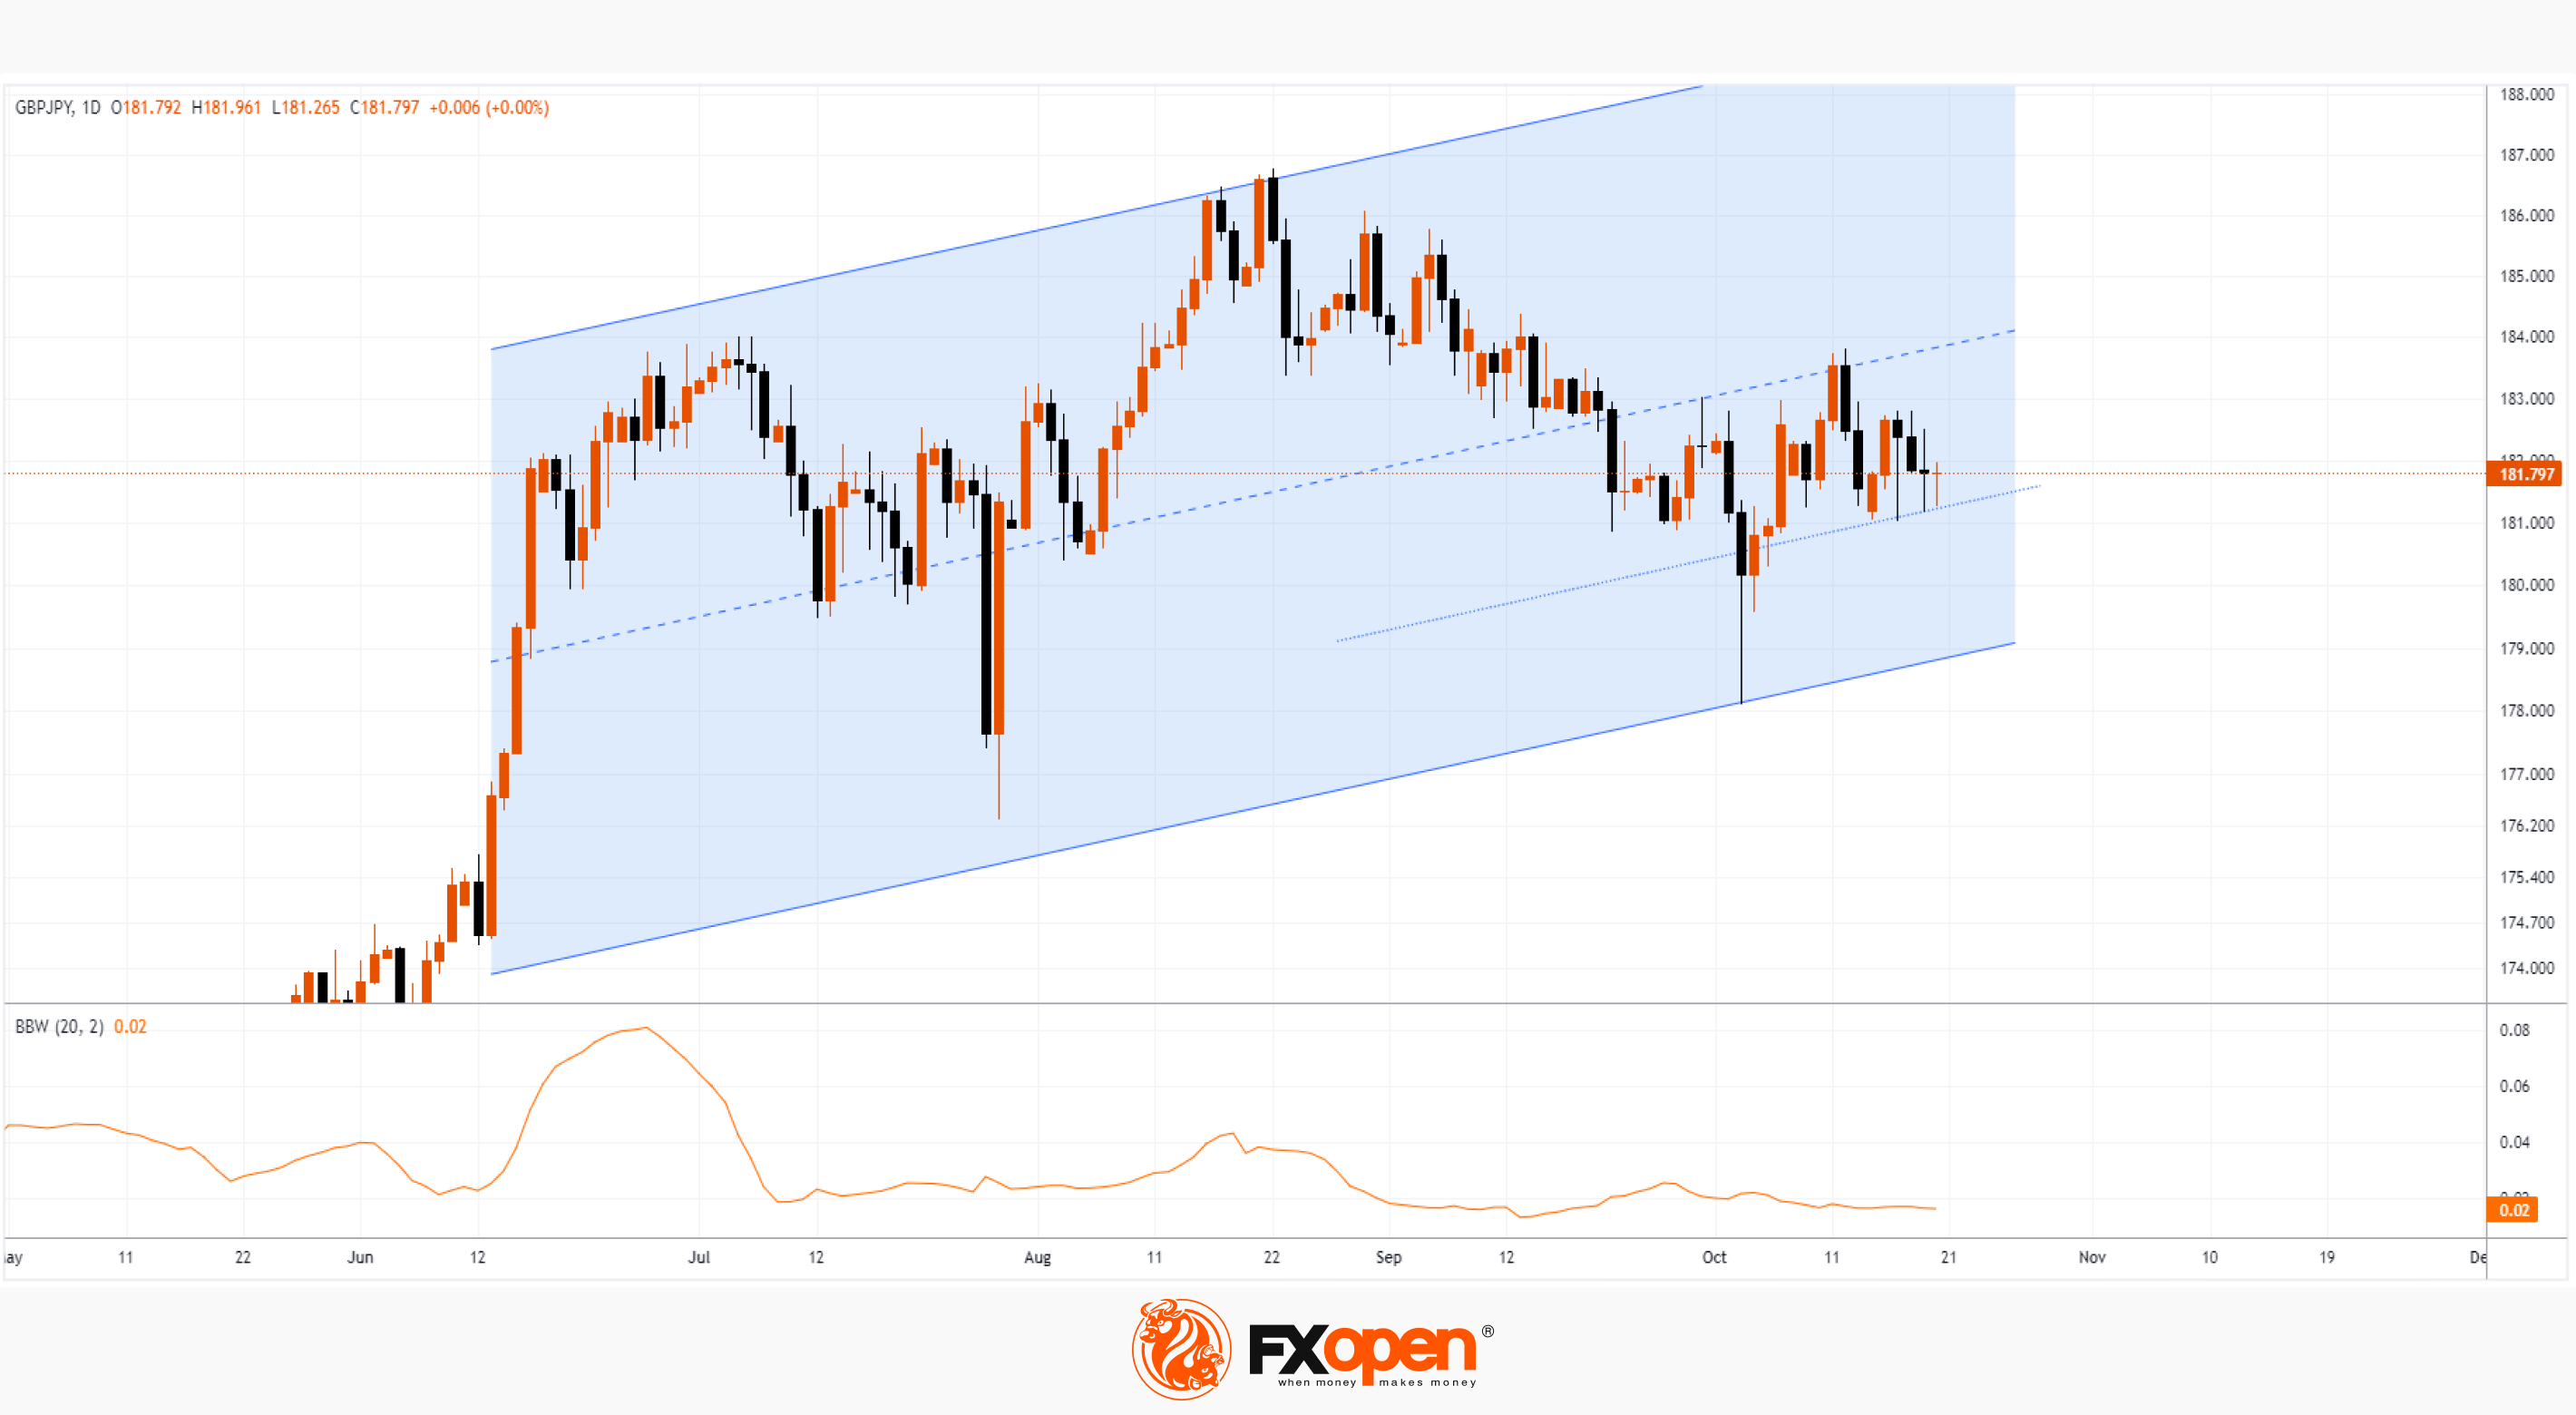
At the same time, the Bollinger Band width indicator is near record lows for the year, as if someone wants to lull the attention of market participants before an important movement. It is possible that this could happen if the Bank of Japan intervenes to support the weakening yen. And then the balance in which GBP/JPY has been since the summer will be disrupted, and a bearish breakdown of the ascending channel will form on the chart (shown in blue).
Trade over 50 forex markets 24 hours a day with FXOpen. Take advantage of low commissions, deep liquidity, and spreads from 0.0 pips (additional fees may apply). Open your FXOpen account now or learn more about trading forex with FXOpen.
This article represents the opinion of the Companies operating under the FXOpen brand only. It is not to be construed as an offer, solicitation, or recommendation with respect to products and services provided by the Companies operating under the FXOpen brand, nor is it to be considered financial advice.
Stay ahead of the market!
Subscribe now to our mailing list and receive the latest market news and insights delivered directly to your inbox.


Latest articles

AI Valuations Are Back in the Spotlight
Artificial intelligence remains the dominant investment theme of 2026, but investors are increasingly questioning whether AI stock valuations are keeping pace with reality.
💰 Big Tech continues to invest at an unprecedented scale, with hyperscaler AI spending projected to exceed $800

AUD/CAD: Months of Indecision — Is a Breakout Finally Coming?
The Australian dollar has clawed back most of its end-of-June losses, when it touched three-month lows against the greenback amid escalating Middle East tensions. Since then, sentiment has improved: the RBA's Assistant Governor Sarah Hunter signalled the board stands ready

USD/JPY: Battling at the Top of the Triangle
On 3 July, Japan's Finance Minister, Satsuki Katayama, stated that the Ministry of Finance remains in close contact with US authorities regarding developments in USD/JPY as the yen traded near its weakest level in almost 40 years. Similar verbal