


GBP/USD Analysis: Inflation Stabilises, Pound Rises in Price
FXOpen

UK inflation data was released this morning, showing that consumer price inflation (CPI) held steady at 6.7% in September, although economists had expected 6.6%, which would mean the CPI would continue to decline from its peak of 11.1%, achieved at the end of last year.
These data provide evidence to suggest that inflation has stalled. And the Bank of England will have to make another interest rate increase. Tighter monetary policy → more expensive currency. Therefore, the pound reacted to the news that inflation had not changed with short-term growth relative to other currencies.
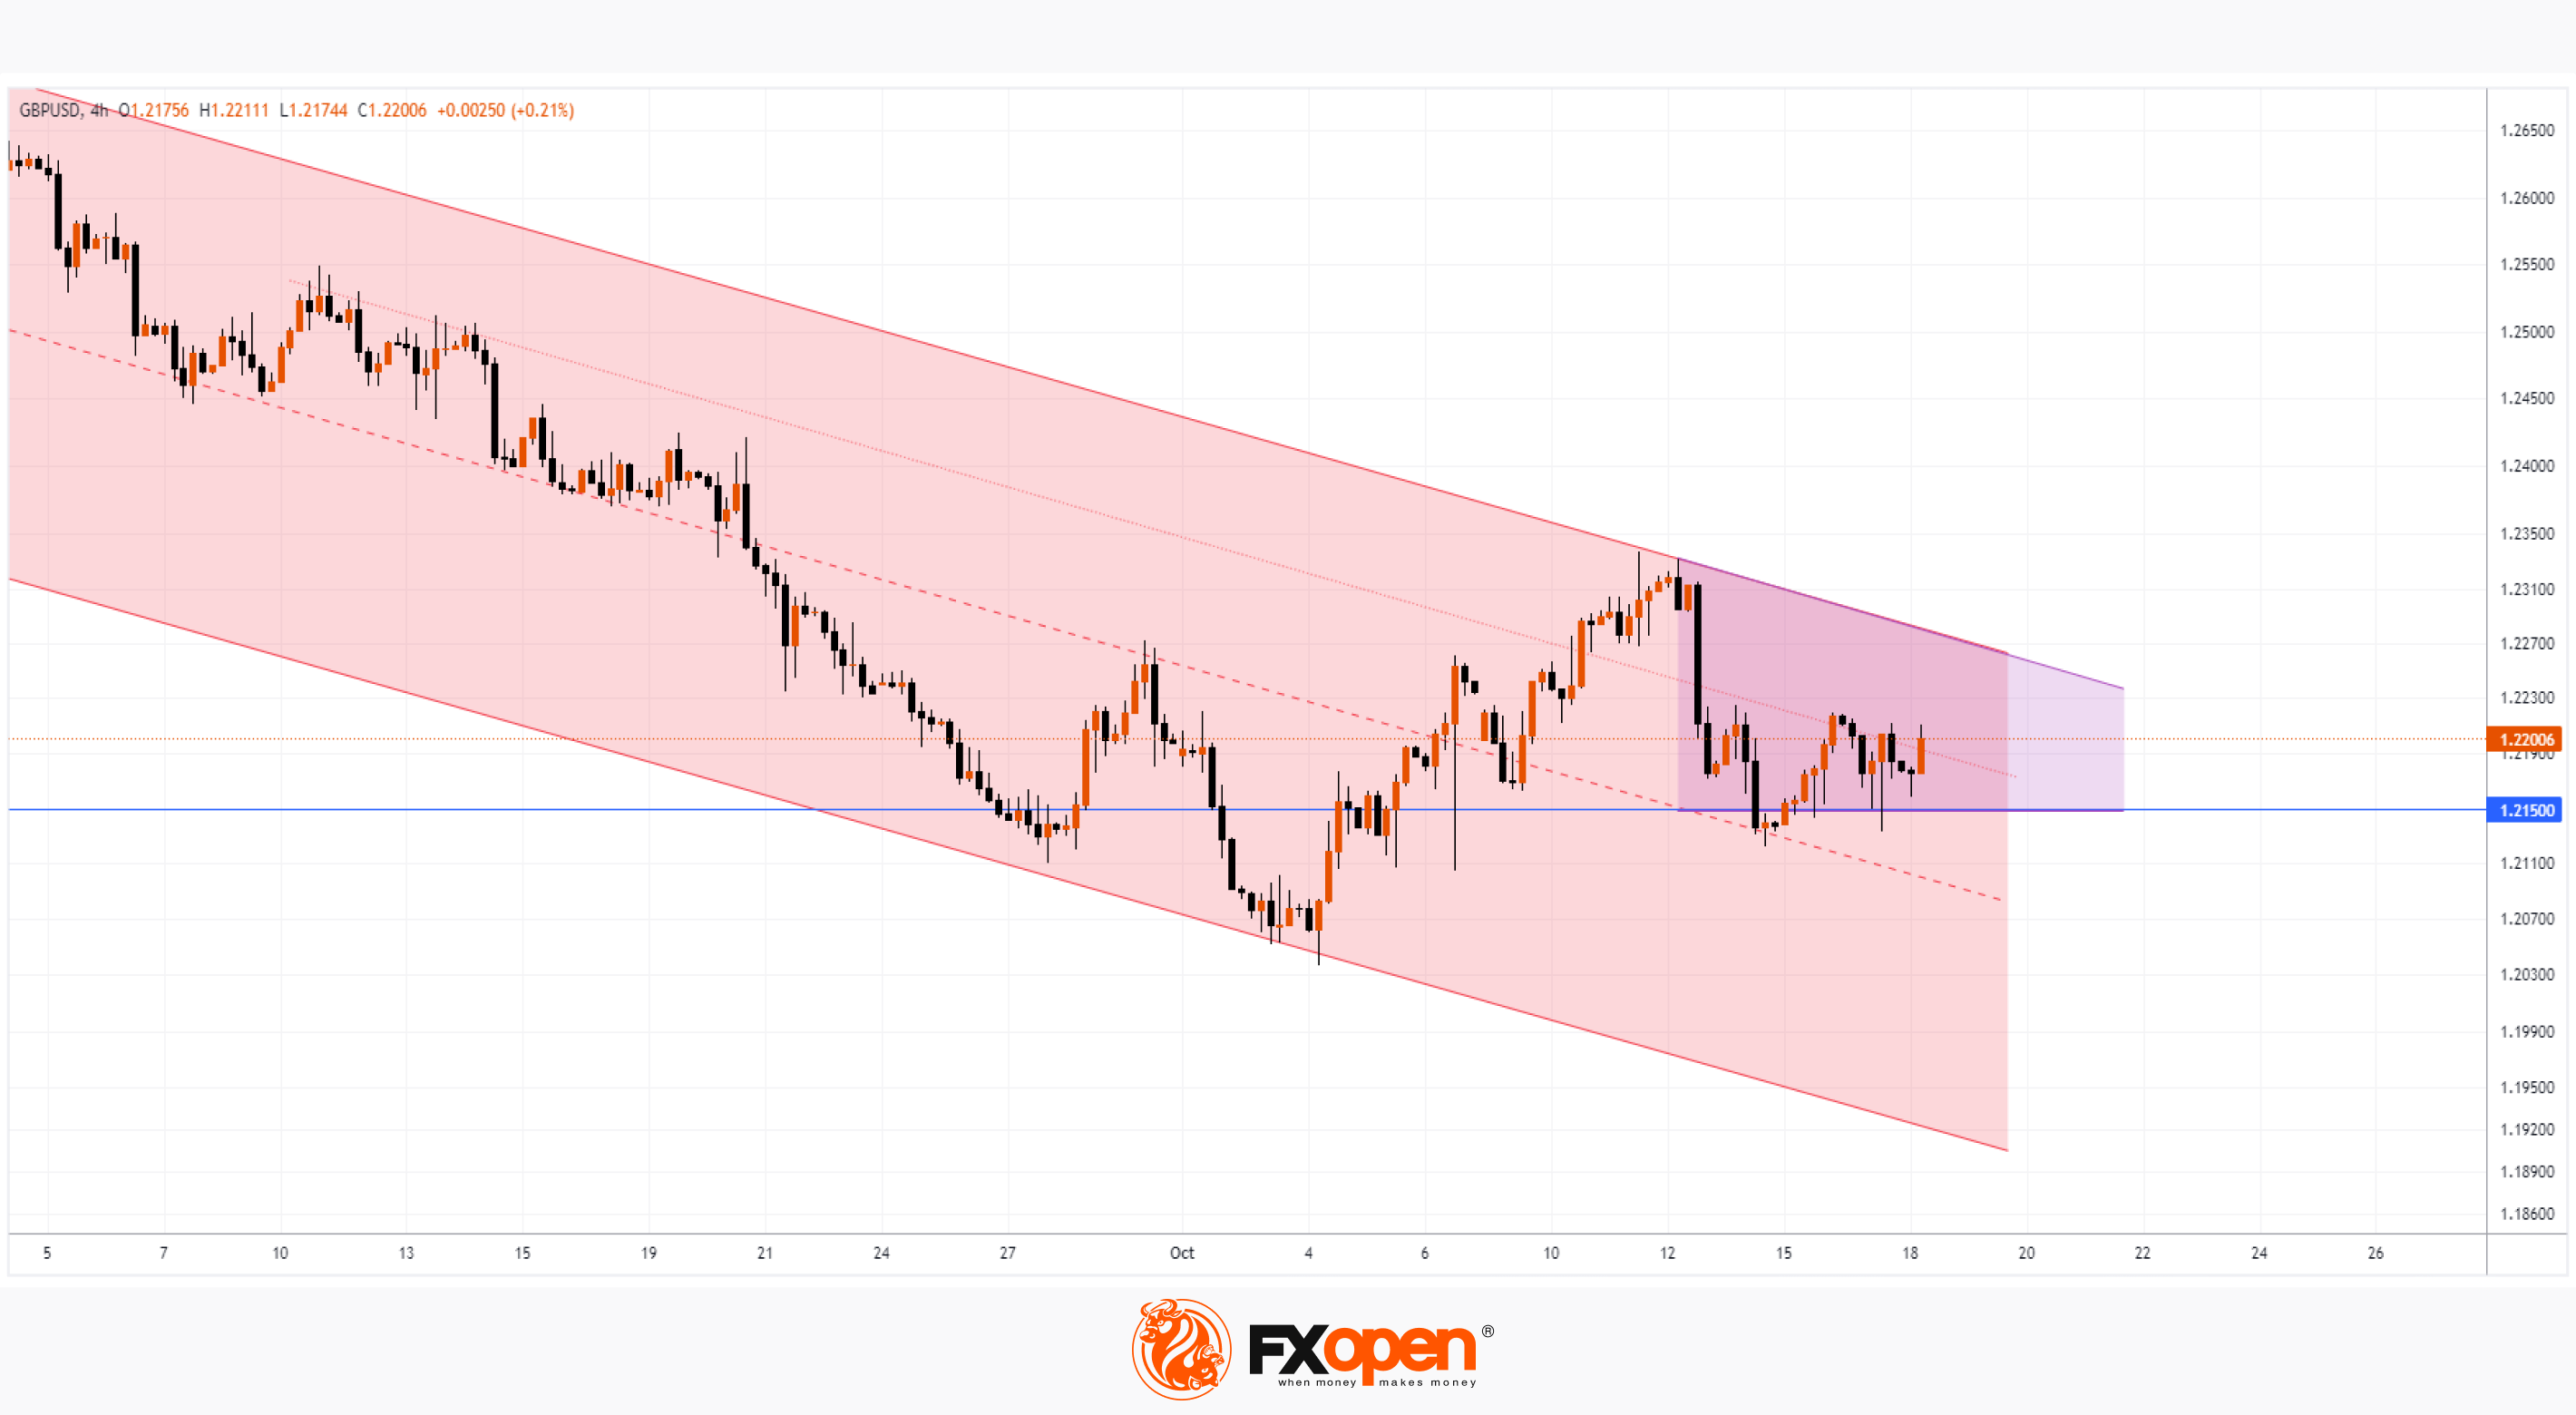
On the GBP/USD chart, a picture emerges indicating that the pound has found important support at the level of 1.215. Judge for yourself:
→ On September 27, the rate dropped lower very uncertainly, but rose very confidently the next day;
→ On October 3, the dive below the level of 1.215 was more significant, but the recovery again was not long in coming. And the bulls were able to lift the GBP/USD rate from the October 4 low by more than 2%;
→ Long lower shadows on the candles (the most noticeable on October 6) indicate demand strength around 1.215;
→ Analysis of the price movement on October 13 shows that this horizontal continues to provide support.
From the bears' point of view, the downward channel is still relevant, but note that its median line is already gaining support properties (judging by the price action at the end of Friday, October 13th).
Considering the facts presented, we can assume that the rate is clamped into a triangle (shown in purple), and if it breaks through, an important impulse can form. Moreover, the drivers for the breakdown may arrive as early as tomorrow: at 15:30 GMT+3, unemployment data in the US will be published, and at 21:00, the head of the Fed will give a speech.
Trade over 50 forex markets 24 hours a day with FXOpen. Take advantage of low commissions, deep liquidity, and spreads from 0.0 pips (additional fees may apply). Open your FXOpen account now or learn more about trading forex with FXOpen.
This article represents the opinion of the Companies operating under the FXOpen brand only. It is not to be construed as an offer, solicitation, or recommendation with respect to products and services provided by the Companies operating under the FXOpen brand, nor is it to be considered financial advice.
Stay ahead of the market!
Subscribe now to our mailing list and receive the latest market news and insights delivered directly to your inbox.


Latest articles

Weekly Market Insights with Gary Thomson: The Week of Central Banks and Earnings
In this video, we’ll explore the key economic events and market trends, shaping the financial landscape. Get ready for insights into financial markets to help you navigate the week ahead. Let’s dive in!
In this episode of Market

Intel at a Crossroads: Earnings Beat Meets Technical Resistance
Intel has just delivered its strongest quarter in over fifteen years, and the market reaction says it all. Q2 2026 revenue surged 25% year-over-year to $16.1 billion, crushing the consensus estimate of $14.42 billion, while adjusted EPS of

Tesla: Complex Range Structure Breaks Down Following Quarterly Earnings
Tesla released its Q2 2026 results after the market closed on 22 July. Revenue increased 26% year-on-year to $28.24 billion, while vehicle deliveries reached a record 480,126 units. However, operating margin fell sharply to 1.4%, down from