


GBP/USD: Bulls Show Resilience amid Inflation and GDP News
FXOpen
Yesterday important data on inflation in the United States was published. It caused a significant spike in volatility in financial markets, even though the values were in line with expectations. CPI in monthly terms: actual = 0.4%, forecast = 0.4%, a month ago = 0.3%, a year ago = 0.4%.
And today news came out about UK GDP in monthly terms, which also corresponded to expectations: fact = +0.2%, forecast = +0.2%, a month ago = -0.1%.
It is noteworthy that in both cases the first reaction was a fall in the price of GBP/USD, but then a recovery followed — this is a manifestation of the stability of demand.
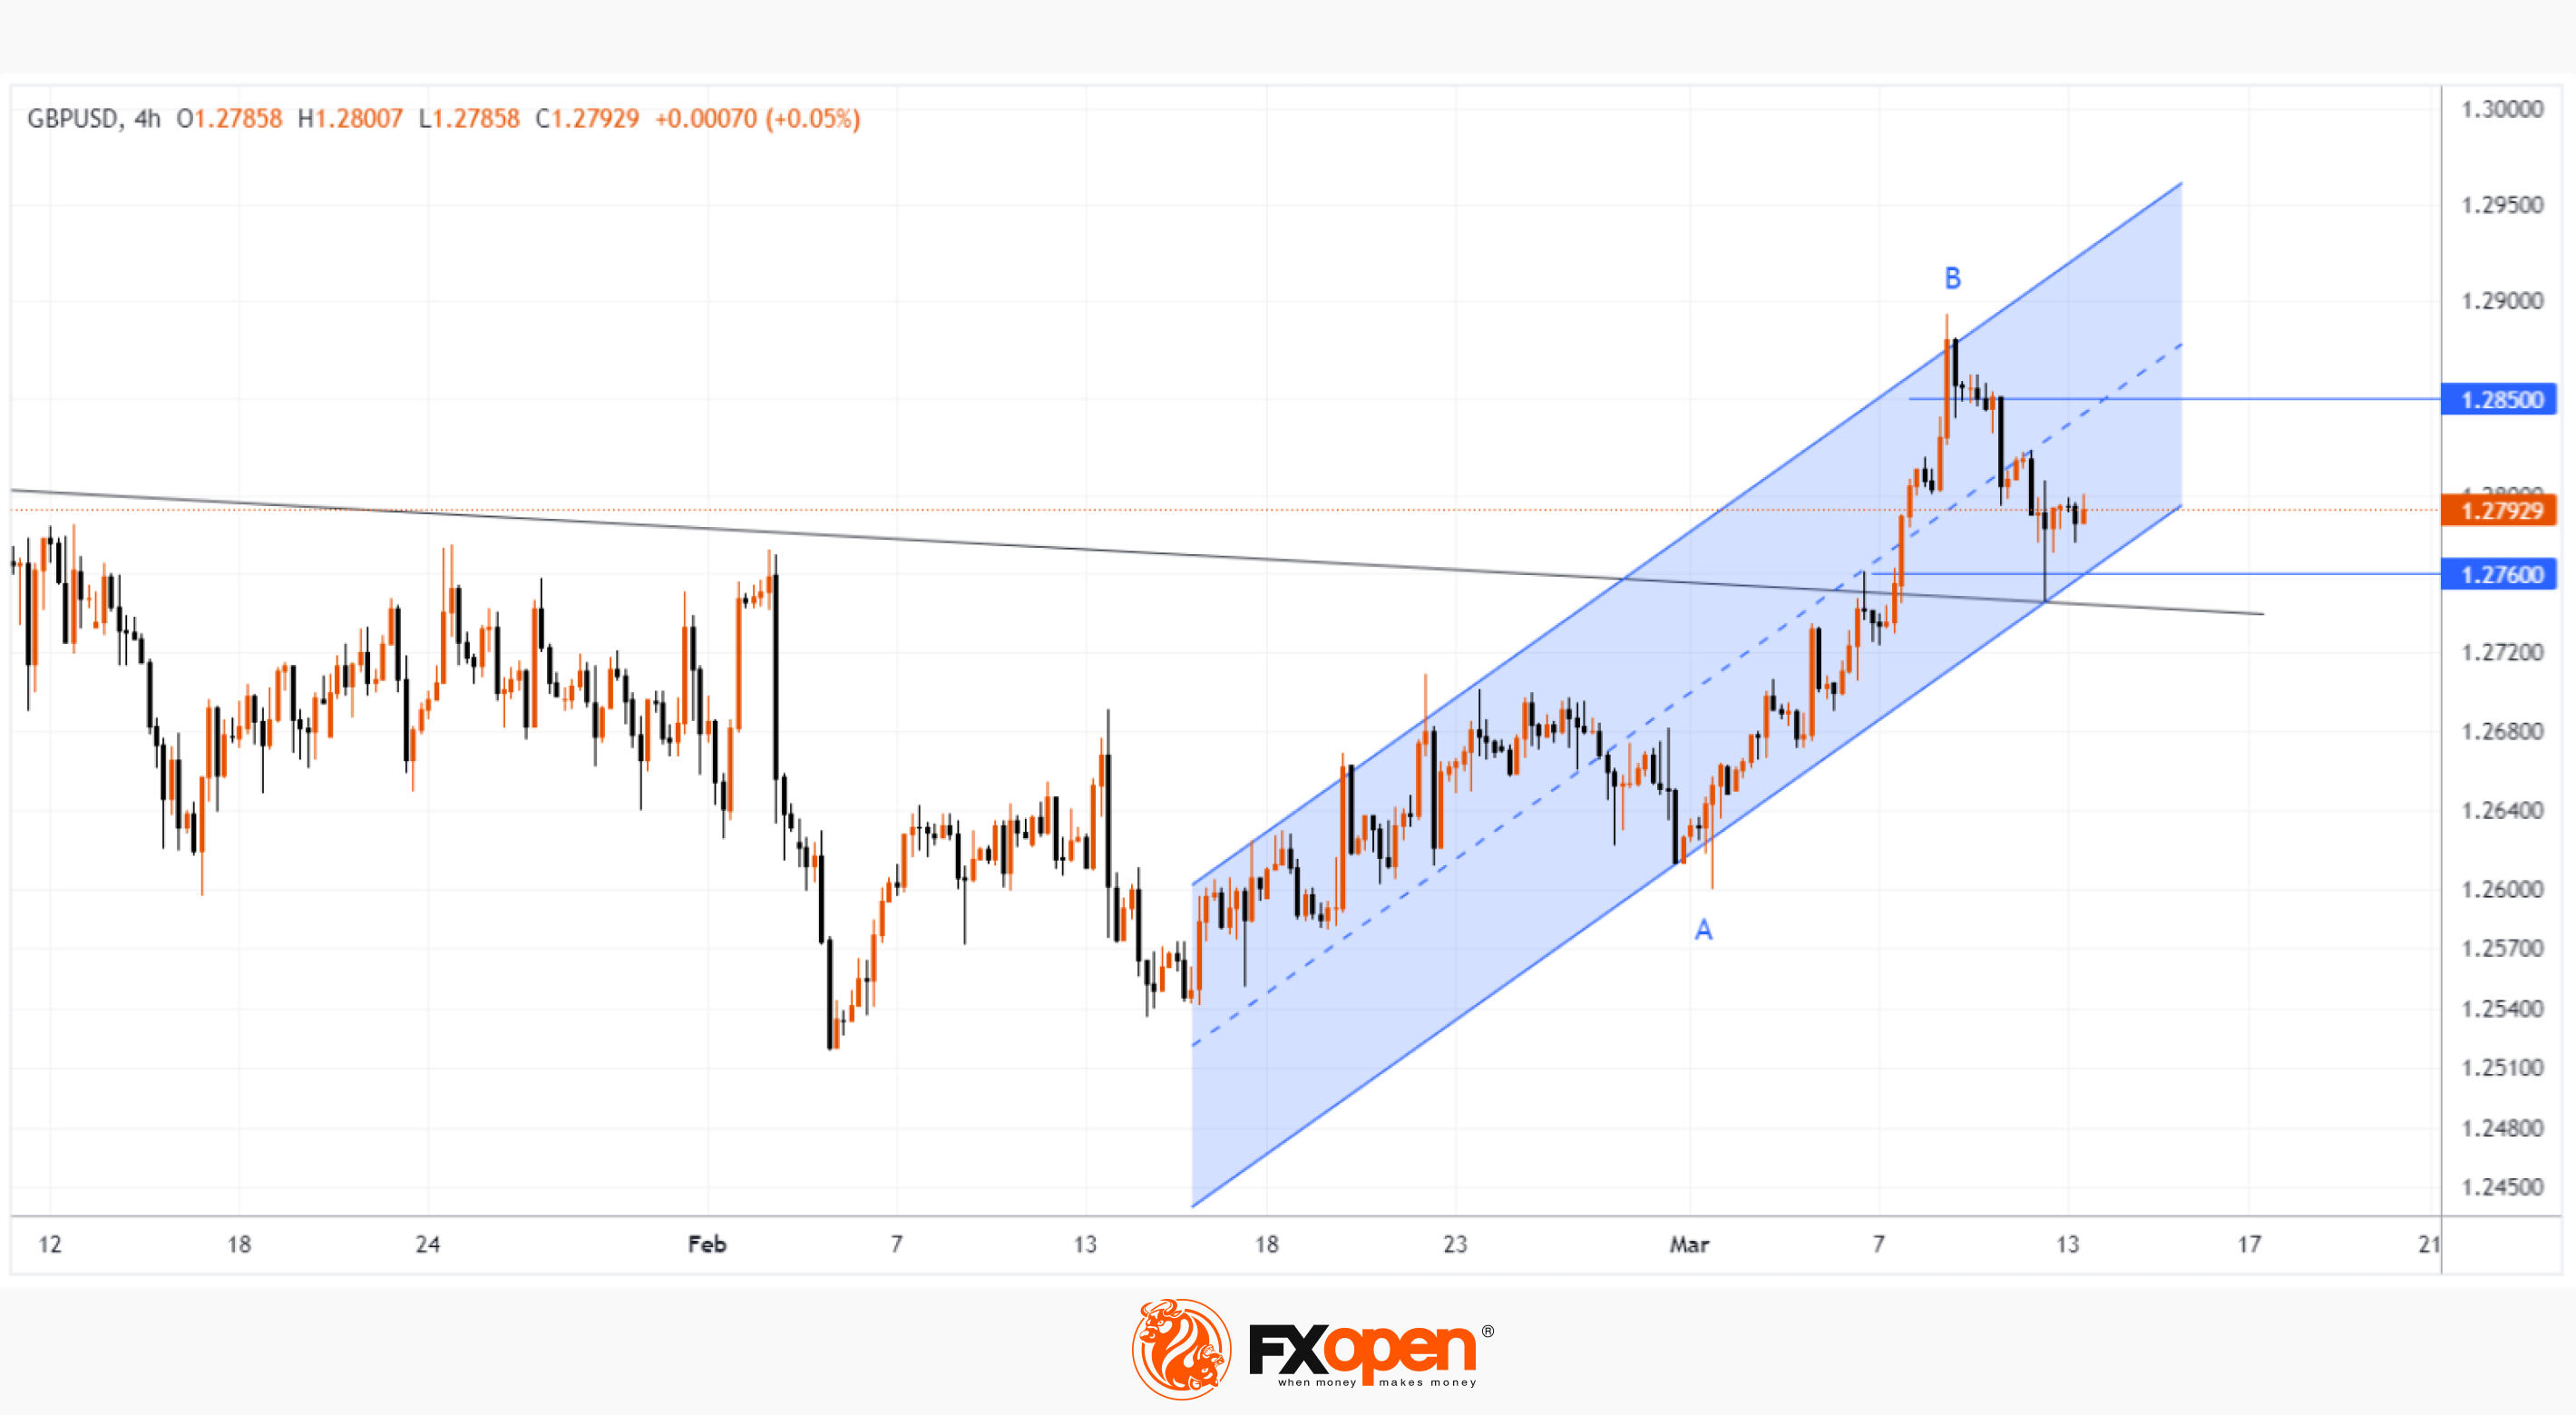
From the point of view of technical analysis of the GBP/USD chart, the market has support in the area of 1.276 from:
→ the bottom line of the ascending channel (shown in blue);
→ Fibo level 50% rollback from impulse A→B;
→ the black long-term trend line originating at the end of 2023, which previously served as resistance, but changed its role after the breakdown on March 7.
Will the bulls be able to resume the upward trend within the blue channel?
Even if attempts to implement this scenario occur, the GBP/USD chart shows that:
→ In this case, they may encounter bearish aggression, visible in sharp price declines from top B.
→ It is possible that resistance will be the level of 1.285, which served as local support on March 10-11, and in the area of which (for now) the median line of the blue ascending channel passes.
Trade over 50 forex markets 24 hours a day with FXOpen. Take advantage of low commissions, deep liquidity, and spreads from 0.0 pips (additional fees may apply). Open your FXOpen account now or learn more about trading forex with FXOpen.
This article represents the opinion of the Companies operating under the FXOpen brand only. It is not to be construed as an offer, solicitation, or recommendation with respect to products and services provided by the Companies operating under the FXOpen brand, nor is it to be considered financial advice.
Stay ahead of the market!
Subscribe now to our mailing list and receive the latest market news and insights delivered directly to your inbox.


Latest articles

Ethereum: Has the Recovery Begun?
Ethereum has staged a notable rebound after once again testing the heavily watched psychological zone around 1500$. Since bouncing off this support, ETH/USD has climbed roughly 13%, now trading around the $1,700 mark.
This recovery is being driven

Oil Prices Are Back at Pre-Conflict Levels. Analysts Are Divided
At the start of May, oil markets were still pricing in elevated geopolitical risk and expectations of sustained supply disruption.
But easing tensions between Washington and Tehran, along with improving supply expectations, have rapidly shifted sentiment back toward fundamentals.
📉 Brent

The Dollar Awaits the Week’s Key Report: AUD/USD and NZD/USD at Crucial Technical Levels
Following mixed performance by the US dollar earlier this week, investors are now fully focused on the June Nonfarm Payrolls report, which will be released on Thursday rather than Friday. The schedule has been brought forward as US financial markets