


FXOpen

According to ICE data, the U.S. Dollar Index futures have reached highs last seen in early July 2024. The dollar’s strength is attributed, in part, to anticipated economic stimulus measures outlined by the newly elected President Donald Trump during his campaign.
This has put pressure on other currencies paired with the dollar. Currently, the British pound is trading near 1.28400, close to a three-month low.
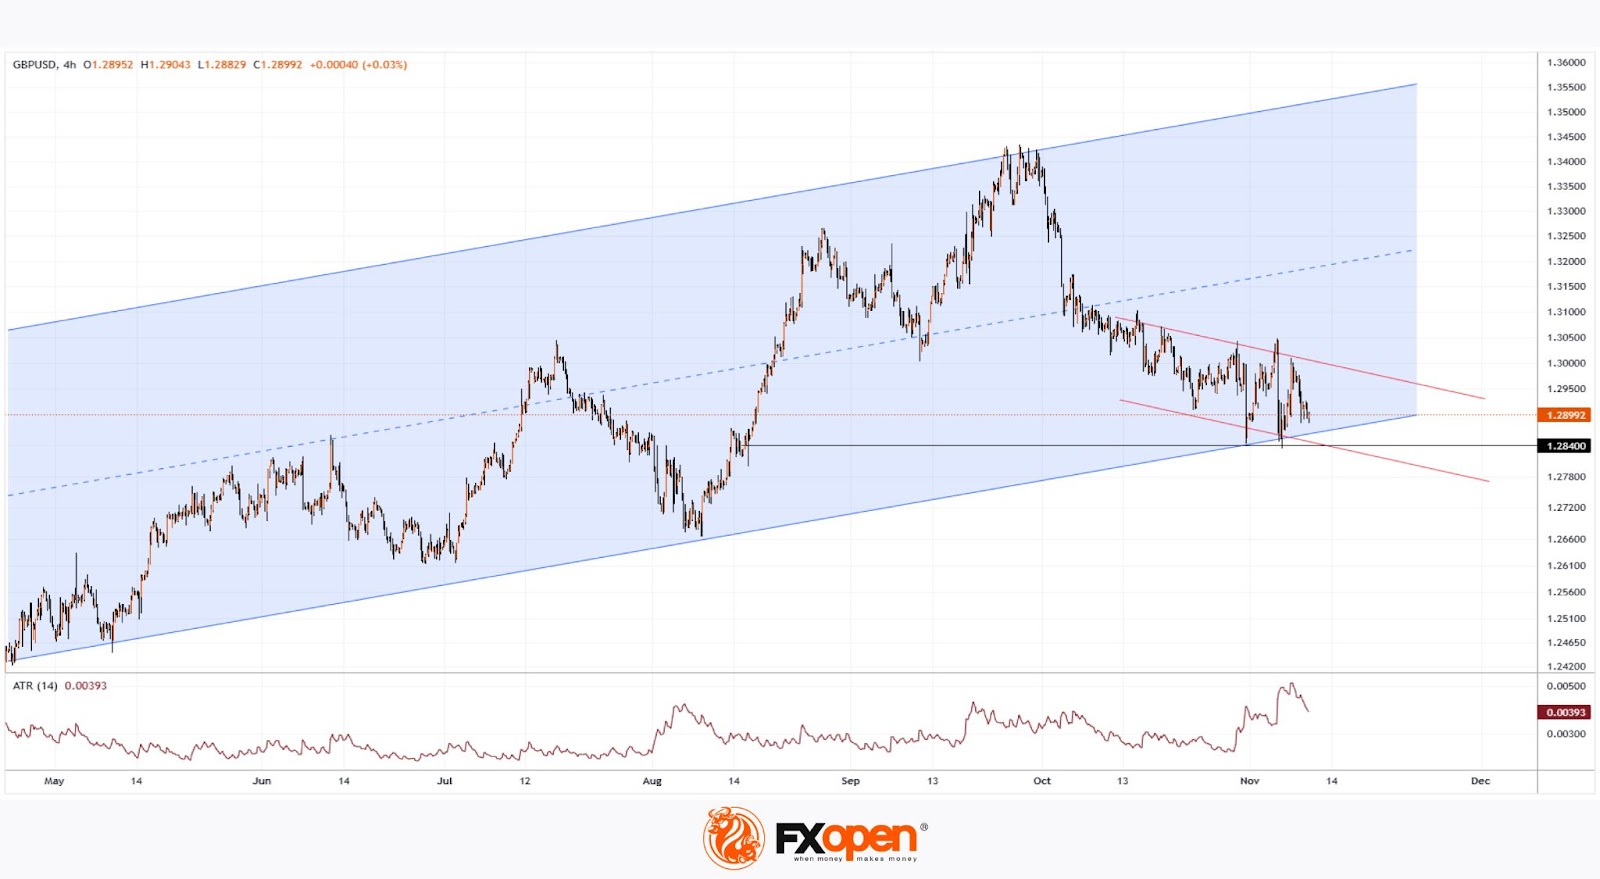
Today’s technical analysis of the 4-hour GBP/USD chart reveals:
→ long-term price fluctuations have shaped an upward channel since May;
→ the pair is near a key support level at the lower boundary of this channel;
→ a downtrend channel (in red) has formed since early October, highlighting recent bearish control; → the ATR indicator is at an annual high, indicating heightened volatility.
Key economic events are on the horizon:
→ UK labour market data on Tuesday at 10:00 (GMT+3),
→ U.S. CPI figures on Wednesday at 16:30 (GMT+3),
→ speeches by the Fed and Bank of England heads on Thursday.
With these events approaching, traders may anticipate continued wide fluctuations around the lower boundary of the upward channel.
Trade over 50 forex markets 24 hours a day with FXOpen. Take advantage of low commissions, deep liquidity, and spreads from 0.0 pips (additional fees may apply). Open your FXOpen account now or learn more about trading forex with FXOpen.
This article represents the opinion of the Companies operating under the FXOpen brand only. It is not to be construed as an offer, solicitation, or recommendation with respect to products and services provided by the Companies operating under the FXOpen brand, nor is it to be considered financial advice.
Stay ahead of the market!
Subscribe now to our mailing list and receive the latest market news and insights delivered directly to your inbox.


Latest articles

Market Analysis: GBP/USD Dips Further As EUR/GBP Regains Traction
GBP/USD failed to climb above 1.3500 and corrected some gains. EUR/GBP started a decent increase and might aim for more gains above 0.8700.
Important Takeaways for GBP/USD and EUR/GBP Analysis Today
· The British Pound


Market Insights with Gary Thomson: Oil, US Retail Sales & NFP in Focus
In this video, we’ll explore the key economic events and market trends, shaping the financial landscape. Get ready for insights into financial markets to help you navigate the week ahead. Let’s dive in!
In this episode of Market