


GBP/USD Exchange Rate Tumbles
FXOpen

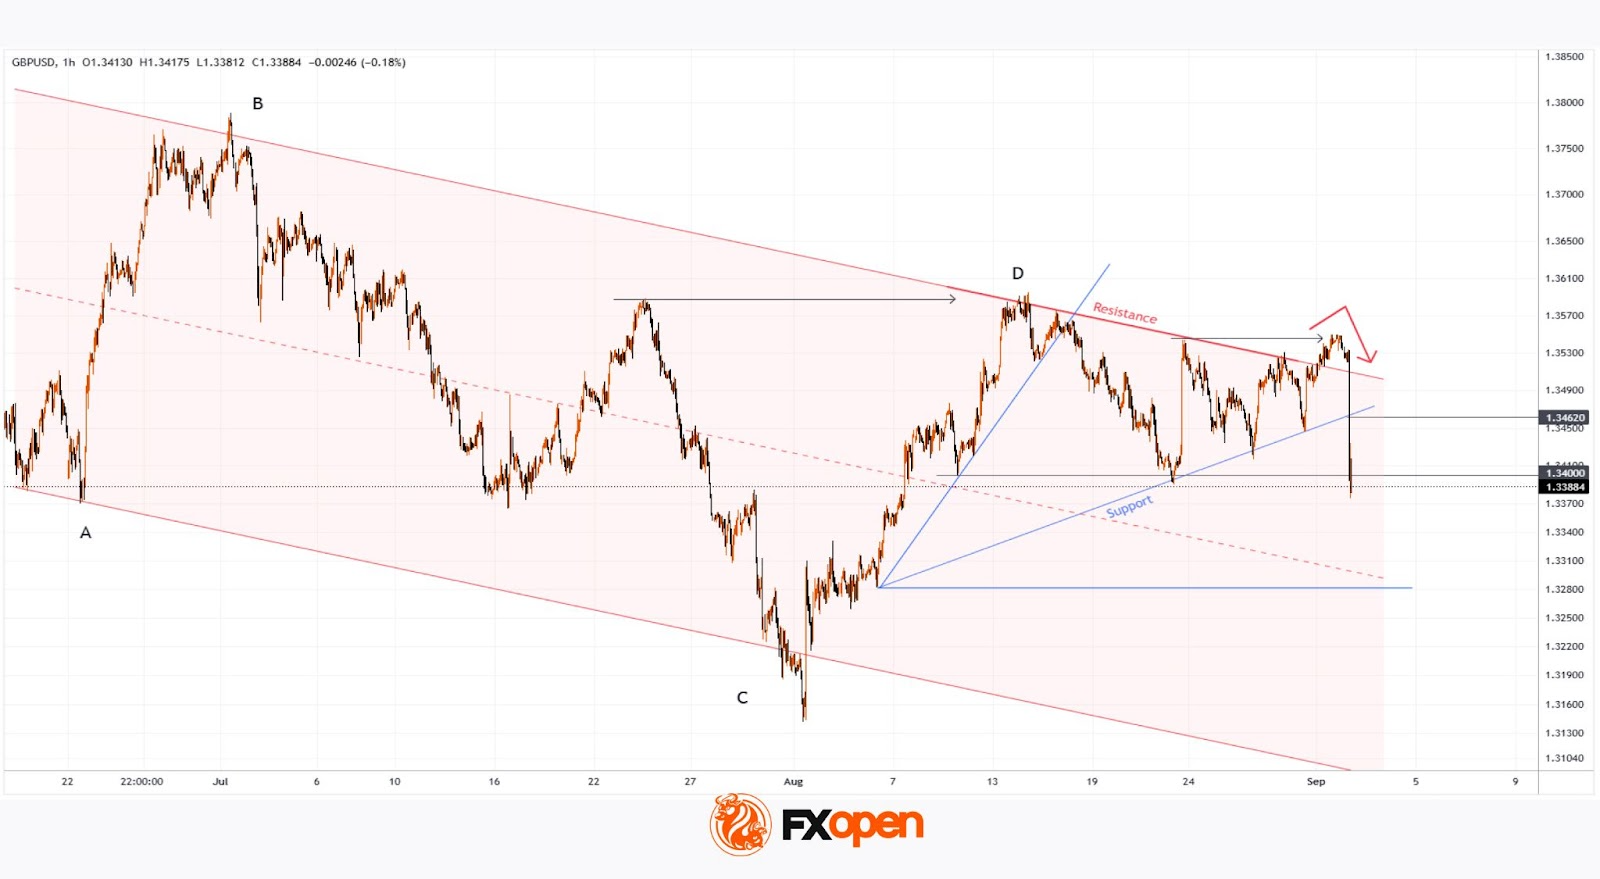
As today’s GBP/USD chart shows, the pound sterling fell by nearly 1% against the US dollar in just one hour, forming an exceptionally long bearish candle.
The sharp drop was driven by concerns over public finances and a broad sell-off in the bond market. According to Reuters, the yield on UK 30-year government bonds hit 5.69% – the highest level since May 1998 – highlighting the elevated risk premium.
Technical analysis of GBP/USD Price Chart
When analysing the pair’s movements in July, we questioned GBP/USD’s ability to sustain growth. Since then, the chart has developed a series of lower highs and lower lows, forming a bearish A→B→C→D structure.
At the end of August, the pair consolidated between the Support and Resistance lines shown on the chart.
Factors reinforcing the bearish context and confirming earlier doubts include:
→ a failed bullish breakout attempt (marked with a red arrow);
→ Liquidity Grab patterns above previous highs (marked with black arrows).
What could happen next?
Today’s decline highlights a strong resistance zone formed by:
→ the breakout level of August’s support around 1.3462;
→ the upper boundary of the descending channel.
Bulls may find some support at the psychological 1.3400 level. However, if pressure increases (particularly if new bearish fundamental drivers emerge), GBP/USD could slide towards the median of the descending channel.
Trade over 50 forex markets 24 hours a day with FXOpen. Take advantage of low commissions, deep liquidity, and spreads from 0.0 pips (additional fees may apply). Open your FXOpen account now or learn more about trading forex with FXOpen.
This article represents the opinion of the Companies operating under the FXOpen brand only. It is not to be construed as an offer, solicitation, or recommendation with respect to products and services provided by the Companies operating under the FXOpen brand, nor is it to be considered financial advice.
Stay ahead of the market!
Subscribe now to our mailing list and receive the latest market news and insights delivered directly to your inbox.


Latest articles

GBP/USD and EUR/GBP Await Key Bank of England Decision
The pound strengthened following the outcome of the US Federal Reserve meeting, where the central bank, as expected, kept interest rates unchanged. However, the Fed did not provide the market with clear signals of an imminent shift towards rate cuts,

Microsoft Analysis: Earnings Beat Expectations
On 29 July 2026, Microsoft reported its results for the fourth quarter of fiscal year 2026. Revenue reached $90 billion, up 18% year-on-year, while adjusted earnings per share came in at $4.74, comfortably ahead of analysts' expectations of $4.

EUR/USD: All Eyes on the Fed as the Range Reaches Its Breaking Point
The dollar's next move hinges on tonight's Fed decision, and this time markets genuinely don't know what to expect. While economists still lean toward a hold—with CME FedWatch odds sitting near 68.5% for no change—Kevin Warsh's hawkish