


FXOpen

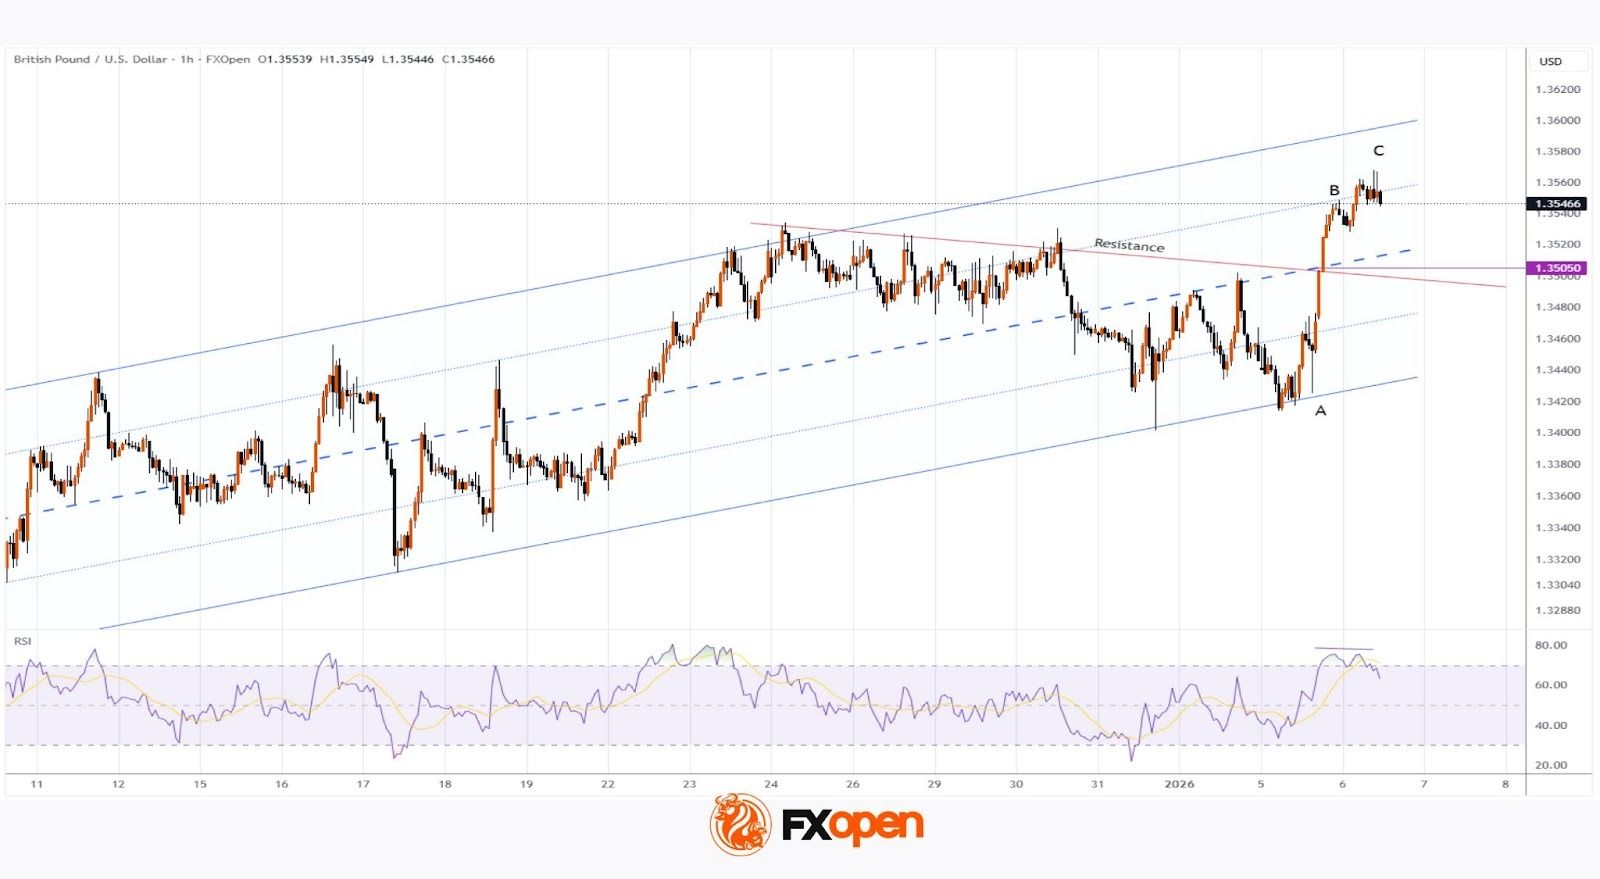
As the GBP/USD chart shows, the pound rose above 1.3560 today — its highest level since September 2025.
The pound’s strength may be driven by expectations of a tighter monetary policy from the Bank of England in 2026, which seems reasonable given that inflation has remained above 3% since April 2025.
At the same time, market participants may be concerned about the implications of US actions in Venezuela, prompting a shift of capital into other currencies and contributing to dollar weakness.
GBP/USD Technical Analysis
In December, GBP/USD formed an ascending channel (shown in blue), which remains relevant in January:
- The sharp rise from point A indicates clear buyer dominance.
- The pair has moved into the upper half of the channel.
It appears that the decline at the end of December, which formed a resistance trendline (shown in red), has ended, and bulls successfully resumed the uptrend by finding support at the lower boundary of the channel.
However, attention should be paid to the RSI on the GBP/USD chart: a bearish divergence is visible between peaks B and C, which can be interpreted as a potential slowdown in the uptrend. On this basis, the market may be vulnerable to a correction. In such a scenario, GBP/USD could fall towards 1.3505, which may act as support given the strength of buyers at this level during the break of the resistance line and the channel’s median.
Trade over 50 forex markets 24 hours a day with FXOpen. Take advantage of low commissions, deep liquidity, and spreads from 0.0 pips (additional fees may apply). Open your FXOpen account now or learn more about trading forex with FXOpen.
This article represents the opinion of the Companies operating under the FXOpen brand only. It is not to be construed as an offer, solicitation, or recommendation with respect to products and services provided by the Companies operating under the FXOpen brand, nor is it to be considered financial advice.
Stay ahead of the market!
Subscribe now to our mailing list and receive the latest market news and insights delivered directly to your inbox.


Latest articles

US Dollar Index (DXY) Rises Above the 100 Level
Today the US Dollar Index (DXY) climbed above the psychological 100 mark for the first time in 2026, supported by a tense fundamental backdrop, with the military conflict in the Middle East acting as the main driver.
→ Financial market participants

USD/JPY and USD/CAD Continue to Rise Ahead of Key Data Releases
The US dollar continues to strengthen against major counterparts as markets await important macroeconomic data scheduled for release in the coming hours. Investors are focusing on US GDP figures, the Personal Consumption Expenditures (PCE) price index, and Canada’s labour

Oracle (ORCL) Shares Jump Above $160
Following a strong earnings report, Oracle shares surged above $160, marking roughly a 1.5-month high:
→ Earnings per share: expected $1.70, actual $1.79;
→ Revenue: expected $16.7bn, actual $17.2bn.
This is the first quarter in 15 years